
Page 269 - Special Topic Session (STS) - Volume 4
P. 269
STS583 Yakob M. S.
the costs relating to the offices, salaries (of 31 staff members), field surveys (10
percent of the total budget), imagery (20 percent of total budget), hardware
(19 workstations) and software (ERDAS, ARCGIS, GEOMATICA STAT licenses).
Another example is CROPWATCH of China’s RADI. Its annual budget for
regional crop monitoring in China and in the major production zones
worldwide (covering 31 countries and representing 80 percent of the world
production of maize, wheat, rice, and soybean), amounts to US$1.5 million.
Manpower costs (15 persons) represent approximately 35 percent of this total
budget; those resulting from imagery data amounts only to 20 of the budget,
thanks to interinstitutional data sharing.
3.4 Sensor suitability
Several examples confirm the efficiency of using remote sensing for
agricultural statistics. An important factor to verify is whether the available
satellites are adapted to the predominant sizes of agricultural fields in the
various regions of the world.
Agricultural monitoring has various facets (cropland areas, crop type
acreages, or yield monitoring at regional or field levels). This enquiry will focus
on the regional acreages of major crop categories (such as cereals), of other
arable land, of permanent cropland and of permanent grassland.
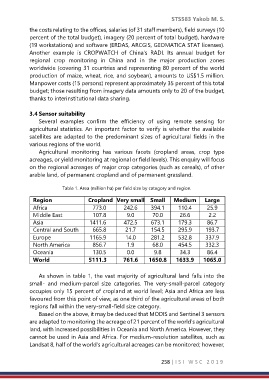
Table 1. Area (million ha) per field size by category and region.
Region Cropland Very small Small Medium Large
Africa 773.0 242.6 394.1 110.4 25.9
Middle East 107.8 9.0 70.0 26.6 2.2
Asia 1411.6 472.5 673.1 179.3 86.7
Central and South 665.8 21.7 154.5 295.9 193.7
America 1165.9 14.0 281.2 532.8 337.9
Europe
North America 856.7 1.9 68.0 454.5 332.3
Oceania 130.5 0.0 9.8 34.3 86.4
World 5111.3 761.6 1650.8 1633.9 1065.0
As shown in table 1, the vast majority of agricultural land falls into the
small- and medium-parcel size categories. The very-small-parcel category
occupies only 15 percent of cropland at world level; Asia and Africa are less
favoured from this point of view, as one third of the agricultural areas of both
regions fall within the very-small-field size category.
Based on the above, it may be deduced that MODIS and Sentinel 3 sensors
are adapted to monitoring the acreage of 21 percent of the world’s agricultural
land, with increased possibilities in Oceania and North America. However, they
cannot be used in Asia and Africa. For medium-resolution satellites, such as
Landsat 8, half of the world’s agricultural acreages can be monitored; however,
258 | I S I W S C 2 0 1 9