
Page 119 - Contributed Paper Session (CPS) - Volume 6
P. 119
CPS1839 Bahija Nali et al.
This process allows both to judge the quality of the output estimated and to
situate it within the national economy.
2. Results of the study
Before presenting the results, it should be noted that this work concerns
a simulation exercise conducted for the last base year of Moroccan accounts
namely 2007. Currently, the process of rebasing our national account is in
progress, and we propose to conduct the same exercise for the new
benchmark year (2014) to ensure a better exhaustiveness of the Moroccan
GDP.
Moreover, it important to note that the comparable component of the
databases between supply and use of labour was the salaried jobs in non
agricultural and non financial private sector.
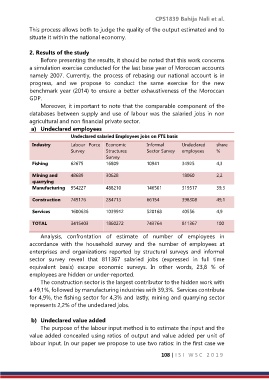
a) Undeclared employees
Undeclared salaried Employees jobs on FTE basis
Industry Labour Force Economic Informal Undeclared share
Survey Structures Sector Survey employees %
Survey
Fishing 62675 16809 10941 34925 4,3
Mining and 48689 30628 18060 2,2
quarrying
Manufacturing 954227 488210 146501 319517 39,3
Construction 749176 284713 66154 398308 49,1
Services 1600636 1039912 520168 40556 4,9
TOTAL 3415403 1860272 743764 811367 100
Analysis, confrontation of estimate of number of employees in
accordance with the household survey and the number of employees at
enterprises and organizations reported by structural surveys and informal
sector survey reveal that 811367 salaried jobs (expressed in full time
equivalent basis) escape economic surveys. In other words, 23,8 % of
employees are hidden or under-reported.
The construction sector is the largest contributor to the hidden work with
a 49,1%, followed by manufacturing industries with 39,3%. Services contribute
for 4,9%, the fishing sector for 4,3% and lastly, mining and quarrying sector
represents 2,2% of the undeclared jobs.
b) Undeclared value added
The purpose of the labour input method is to estimate the input and the
value added concealed using ratios of output and value added per unit of
labour input. In our paper we propose to use two ratios: in the first case we
108 | I S I W S C 2 0 1 9