
Page 247 - Special Topic Session (STS) - Volume 2
P. 247
STS489 Chibuzor C. N. et al.
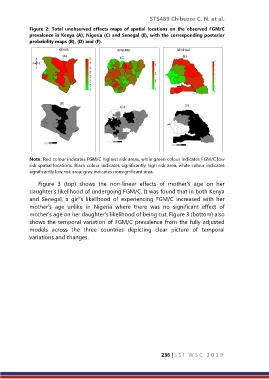
Figure 2: Total unobserved effects maps of spatial locations on the observed FGM/C
prevalence in Kenya (A), Nigeria (C) and Senegal (E), with the corresponding posterior
probability maps (B), (D) and (F).
Note. Red colour indicates FGM/C highest risk areas, while green colour indicates FGM/C low
risk spatial locations. Black colour indicates significantly high risk area; white colour indicates
significantly low risk area; grey indicates nonsignificant area.
Figure 3 (top) shows the non-linear effects of mother’s age on her
daughter’s likelihood of undergoing FGM/C. It was found that in both Kenya
and Senegal, a girl’s likelihood of experiencing FGM/C increased with her
mother’s age unlike in Nigeria where there was no significant effect of
mother’s age on her daughter’s likelihood of being cut. Figure 3 (bottom) also
shows the temporal variation of FGM/C prevalence from the fully adjusted
models across the three countries depicting clear picture of temporal
variations and changes.
236 | I S I W S C 2 0 1 9