
Page 229 - Special Topic Session (STS) - Volume 3
P. 229
STS541 Masao T. et al.
Tabulation on Industries” for the 2010 Population Census. The results of the
tabulation were released from the end of May to mid-July 2011.
In addition, to make it easier to use statistical data on disaster-stricken
areas, the SBJ extracted the major statistical indices of the affected areas from
the municipal statistical database of the System of Social and Demographic
Statistics of Japan, and published a summary data sheet including data on the
earthquake damage, on the website of the SBJ.
To make it easy for anyone to find and use this information, the SBJ set up
a dedicated webpage on the SBJ website, on which information related to the
Great East Japan Earthquake along with various statistical data and
information on disaster areas were posted.
5. Statistical Analyses on the Effects of the Earthquake
Statistical results after the earthquake allowed us to understand the effects
of the disaster on society and the economy and the situation of recovery. For
this reason, the SBJ released commentaries on useful findings whenever new
statistics became available. Some examples are as follows.
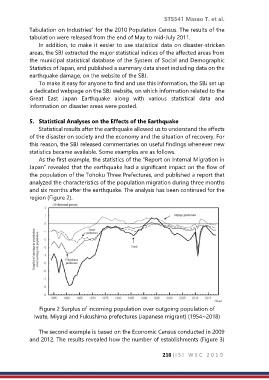
As the first example, the statistics of the “Report on Internal Migration in
Japan” revealed that the earthquake had a significant impact on the flow of
the population of the Tohoku Three Prefectures, and published a report that
analyzed the characteristics of the population migration during three months
and six months after the earthquake. The analysis has been continued for the
region (Figure 2).
Figure 2 Surplus of incoming population over outgoing population of
Iwate, Miyagi and Fukushima prefectures (Japanese migrant) (1954~2018)
The second example is based on the Economic Census conducted in 2009
and 2012. The results revealed how the number of establishments (Figure 3)
218 |I S I W S C 2 0 1 9