
Page 217 - Special Topic Session (STS) - Volume 4
P. 217
STS580 Vassilis P. P.
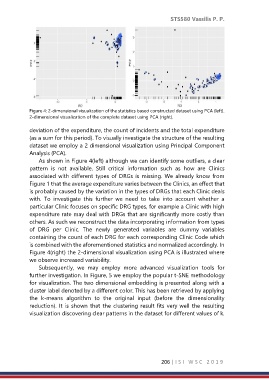
Figure 4: 2-dimensional visualization of the statistics based constructed dataset using PCA (left).
2-dimensional visualization of the complete dataset using PCA (right).
deviation of the expenditure, the count of incidents and the total expenditure
(as a sum for this period). To visually investigate the structure of the resulting
dataset we employ a 2 dimensional visualization using Principal Component
Analysis (PCA).
As shown in Figure 4(left) although we can identify some outliers, a clear
pattern is not available. Still critical information such as how are Clinics
associated with different types of DRGs is missing. We already know from
Figure 1 that the average expenditure varies between the Clinics, an effect that
is probably caused by the variation in the types of DRGs that each Clinic deals
with. To investigate this further we need to take into account whether a
particular Clinic focuses on specific DRG types, for example a Clinic with high
expenditure rate may deal with DRGs that are significantly more costly than
others. As such we reconstruct the data incorporating information from types
of DRG per Clinic. The newly generated variables are dummy variables
containing the count of each DRG for each corresponding Clinic Code which
is combined with the aforementioned statistics and normalized accordingly. In
Figure 4(right) the 2-dimensional visualization using PCA is illustrated where
we observe increased variability.
Subsequently, we may employ more advanced visualization tools for
further investigation. In Figure, 5 we employ the popular t-SNE methodology
for visualization. The two dimensional embedding is presented along with a
cluster label denoted by a different color. This has been retrieved by applying
the k-means algorithm to the original input (before the dimensionality
reduction). It is shown that the clustering result fits very well the resulting
visualization discovering clear patterns in the dataset for different values of k.
206 | I S I W S C 2 0 1 9