
Page 320 - Contributed Paper Session (CPS) - Volume 7
P. 320
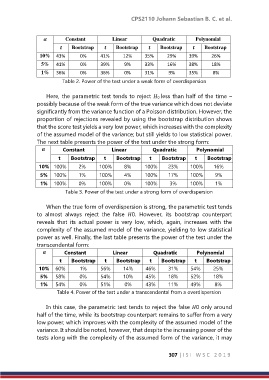
CPS2110 Johann Sebastian B. C. et al.


                        Constant          Linear          Quadratic       Polynomial
                            Bootstrap        Bootstrap        Bootstrap        Bootstrap
                10%   43%       0%      41%     12%      35%     29%     39%      26%
                 5%   41%       0%      39%      9%      33%     16%     38%      18%
                 1%   36%       0%      36%      0%      31%      9%     35%       8%
                         Table 2. Power of the test under a weak form of overdispersion

                   Here, the parametric test tends to reject 0 less than half of the time –
               possibly because of the weak form of the true variance which does not deviate
               significantly from the variance function of a Poisson distribution. However, the
               proportion of rejections revealed by using the bootstrap distribution shows
               that the score test yields a very low power, which increases with the complexity
               of the assumed model of the variance; but still yields to low statistical power.
               The next table presents the power of the test under the strong form:
                       Constant           Linear          Quadratic       Polynomial
                       t    Bootstrap    t    Bootstrap    t    Bootstrap    t    Bootstrap
                10%   100%     2%      100%      8%      100%     23%     100%     16%
                5%   100%      1%      100%      4%      100%     17%     100%      9%
                1%   100%      0%      100%      0%      100%     3%      100%      1%
                          Table 3. Power of the test under a strong form of overdispersion

                   When the true form of overdispersion is strong, the parametric test tends
               to  almost  always  reject  the  false  0.  However,  its  bootstrap  counterpart
               reveals  that  its  actual  power  is  very  low,  which,  again,  increases  with  the
               complexity of the assumed model of the variance, yielding to low statistical
               power as well. Finally, the last table presents the power of the test under the
               transcendental form:
                        Constant          Linear          Quadratic       Polynomial
                        t    Bootstrap    t    Bootstrap    t    Bootstrap    t    Bootstrap
                10%   60%       1%      56%     14%      46%      31%     54%      25%
                5%   58%        0%      54%     10%      45%      18%     52%      18%
                1%   54%        0%      51%      0%      43%      11%     49%      8%
                       Table 4. Power of the test under a transcendental from a overdispersion

                   In this case, the parametric test tends to reject the false 0 only around
               half of the time, while its bootstrap counterpart remains to suffer from a very
               low power, which improves with the complexity of the assumed model of the
               variance. It should be noted, however, that despite the increasing power of the
               tests along with the complexity of the assumed form of the variance, it may


                                                                  307 | I S I   W S C   2 0 1 9