
Page 376 - Contributed Paper Session (CPS) - Volume 7
P. 376
CPS2137 Intan Mastura R. et al.
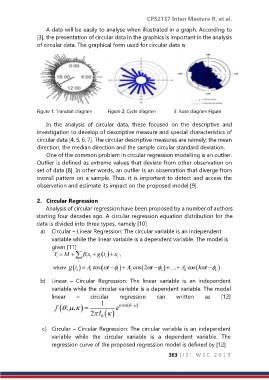
A data will be easily to analyse when illustrated in a graph. According to
[3], the presentation of circular data in the graphics is important in the analysis
of circular data. The graphical form used for circular data is
Figure 1: Transmit diagram Figure 2: Cycle diagram 3: Rose diagram Figure
In the analysis of circular data, these focused on the descriptive and
investigation to develop of descriptive measure and special characteristics of
circular data [4, 5, 6, 7]. The circular descriptive measures are namely; the mean
direction, the median direction and the sample circular standard deviation.
One of the common problem in circular regression modelling is an outlier.
Outlier is defined as extreme values that deviate from other observation on
set of data [8]. In other words, an outlier is an observation that diverge from
overall pattern on a sample. Thus, it is important to detect and access the
observation and estimate its impact on the proposed model [9].
2. Circular Regression
Analysis of circular regression have been proposed by a number of authors
starting four decades ago. A circular regression equation distribution for the
data is divided into three types, namely [10]
a) Circular – Linear Regression: The circular variable is an independent
variable while the linear variable is a dependent variable. The model is
given [11]
b) Linear – Circular Regression: The linear variable is an independent
variable while the circular variable is a dependent variable. The model
linear – circular regression can written as [12]
c) Circular – Circular Regression: The circular variable is an independent
variable while the circular variable is a dependent variable. The
regression curve of the proposed regression model is defined by [12]
363 | I S I W S C 2 0 1 9