
Page 66 - Contributed Paper Session (CPS) - Volume 7
P. 66
CPS2029 Amira Al-Salhi
Table 1 shows the mean values of temperature, humidity, and rainfall for
the different seasons in Salalah from January 2011 to December 2017. The
September quarter has the lowest temperature mean value and the highest
amount of rainfall due to the highest percentage of humidity whereas June
quarter has the highest temperature mean value.
Table 1: Average temperature (°C), average humidity (%), and average rainfall (mm)
in Salalah, 2011‐2017
Temperature Humidity Rainfall
(°C) (%) (mm)
Winter (March quarter) 32.1 84.8 1.1
Spring (June quarter) 34.6 90.3 1.8
Summer (September quarter) 30.3 91.3 10.0
Fall (December quarter) 33.2 84.3 4.9
Source: National Centre for Statistics & Information
Salalah attracts many people from other parts of Oman, the GCC and other
Arab countries during the monsoon/khareef season.
The total number of tourists to Salalah in fall season in 2017 reached about
644,931 tourists, with an average increase of 12% from 2011 to 2017. Around
94% of tourists to Salalah in 2017 came for leisure. Domestic visitors (from
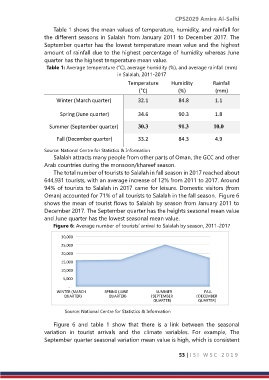
Oman) accounted for 71% of all tourists to Salalah in the fall season. Figure 6
shows the mean of tourist flows to Salalah by season from January 2011 to
December 2017. The September quarter has the heights seasonal mean value
and June quarter has the lowest seasonal mean value.
Figure 6: Average number of tourists’ arrival to Salalah by season, 2011‐2017
30,000
25,000
20,000
15,000
10,000
5,000
-
SUMMER
FALL
WINTER (MARCH SPRING (JUNE ( SEPTEMBER ( DECEMBER
QUARTER)
QUARTER)
QUARTER) QUARTER)
Source: National Centre for Statistics & Information
Figure 6 and table 1 show that there is a link between the seasonal
variation in tourist arrivals and the climate variables. For example, The
September quarter seasonal variation mean value is high, which is consistent
53 | I S I W S C 2 0 1 9