
Page 44 - Contributed Paper Session (CPS) - Volume 6
P. 44
CPS1484 Neela A Gulanikar et al.
3. Result
As a starting point of the simulation study instead of starting with the
completely random values, we use the education attainment data available
for US population. The sex-wise population data for US for the years 2008,
2010, 2017 which contains 10 different levels of education namely None
(no schooling),NonHighSchool, HighSchoolGrad, SomeCollNoDegree,
AssoDegreeOccu, AssoDegreeAca, BachelorDegree, MasterDegree,
ProfDegree, DoctDegree are available on the internet. The overall marriage
rates are also available. Using these overall marriage rates and using the
assumption of hypergamy we construct a 10 × 10 matrix ρ.
Using this same marriage rate matrix, we then generate three different
marriage matrices (ψ) corresponding to three different years by using the
three different matrices for educational attainment. This process is
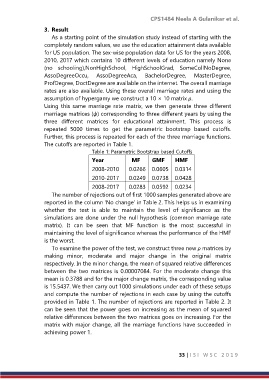
repeated 5000 times to get the parametric bootstrap based cutoffs.
Further, this process is repeated for each of the three marriage functions.
The cutoffs are reported in Table 1.
Table 1: Parametric Bootstrap based Cutoffs
Year MF GMF HMF
2008-2010 0.0266 0.0605 0.0314
2010-2017 0.0249 0.0738 0.0428
2008-2017 0.0283 0.0592 0.0234
The number of rejections out of first 1000 samples generated above are
reported in the column ‘No change’ in Table 2. This helps us in examining
whether the test is able to maintain the level of significance as the
simulations are done under the null hypothesis (common marriage rate
matrix). It can be seen that MF function is the most successful in
maintaining the level of significance whereas the performance of the HMF
is the worst.
To examine the power of the test, we construct three new ρ matrices by
making minor, moderate and major change in the original matrix
respectively. In the minor change, the mean of squared relative differences
between the two matrices is 0.00007084. For the moderate change this
mean is 0.3788 and for the major change matrix, the corresponding value
is 15.5437. We then carry out 1000 simulations under each of these setups
and compute the number of rejections in each case by using the cutoffs
provided in Table 1. The number of rejections are reported in Table 2. It
can be seen that the power goes on increasing as the mean of squared
relative differences between the two matrices goes on increasing. For the
matrix with major change, all the marriage functions have succeeded in
achieving power 1.
33 | I S I W S C 2 0 1 9