
Page 119 - Invited Paper Session (IPS) - Volume 1
P. 119
IPS102 Ilja K. K. et al.
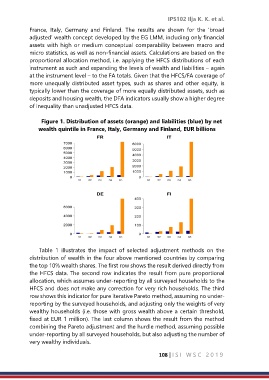
France, Italy, Germany and Finland. The results are shown for the ‘broad
adjusted’ wealth concept developed by the EG LMM, including only financial
assets with high or medium conceptual comparability between macro and
micro statistics, as well as non-financial assets. Calculations are based on the
proportional allocation method, i.e. applying the HFCS distributions of each
instrument as such and expanding the levels of wealth and liabilities – again
at the instrument level – to the FA totals. Given that the HFCS/FA coverage of
more unequally distributed asset types, such as shares and other equity, is
typically lower than the coverage of more equally distributed assets, such as
deposits and housing wealth, the DFA indicators usually show a higher degree
of inequality than unadjusted HFCS data.
Figure 1. Distribution of assets (orange) and liabilities (blue) by net
wealth quintile in France, Italy, Germany and Finland, EUR billions
Table 1 illustrates the impact of selected adjustment methods on the
distribution of wealth in the four above mentioned countries by comparing
the top 10% wealth shares. The first row shows the result derived directly from
the HFCS data. The second row indicates the result from pure proportional
allocation, which assumes under-reporting by all surveyed households to the
HFCS and does not make any correction for very rich households. The third
row shows this indicator for pure iterative Pareto method, assuming no under-
reporting by the surveyed households, and adjusting only the weights of very
wealthy households (i.e. those with gross wealth above a certain threshold,
fixed at EUR 1 million). The last column shows the result from the method
combining the Pareto adjustment and the hurdle method, assuming possible
under-reporting by all surveyed households, but also adjusting the number of
very wealthy individuals.
108 | I S I W S C 2 0 1 9