
Page 120 - Invited Paper Session (IPS) - Volume 1
P. 120
IPS102 Ilja K. K. et al.
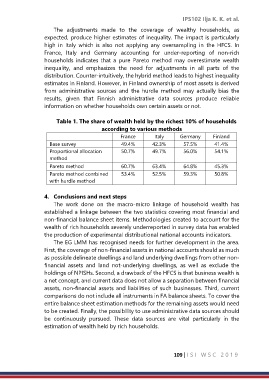
The adjustments made to the coverage of wealthy households, as
expected, produce higher estimates of inequality. The impact is particularly
high in Italy which is also not applying any oversampling in the HFCS. In
France, Italy and Germany accounting for under-reporting of non-rich
households indicates that a pure Pareto method may overestimate wealth
inequality, and emphasizes the need for adjustments in all parts of the
distribution. Counter-intuitively, the hybrid method leads to highest inequality
estimates in Finland. However, in Finland ownership of most assets is derived
from administrative sources and the hurdle method may actually bias the
results, given that Finnish administrative data sources produce reliable
information on whether households own certain assets or not.
Table 1. The share of wealth held by the richest 10% of households
according to various methods
France Italy Germany Finland
Base survey 49.4% 42.3% 57.5% 41.4%
Proportional allocation 50.7% 49.7% 56.0% 54.1%
method
Pareto method 60.7% 63.4% 64.8% 45.3%
Pareto method combined 53.4% 52.5% 59.3% 50.8%
with hurdle method
4. Conclusions and next steps
The work done on the macro-micro linkage of household wealth has
established a linkage between the two statistics covering most financial and
non-financial balance sheet items. Methodologies created to account for the
wealth of rich households severely underreported in survey data has enabled
the production of experimental distributional national accounts indicators.
The EG LMM has recognised needs for further development in the area.
First, the coverage of non-financial assets in national accounts should as much
as possible delineate dwellings and land underlying dwellings from other non-
financial assets and land not-underlying dwellings, as well as exclude the
holdings of NPISHs. Second, a drawback of the HFCS is that business wealth is
a net concept, and current data does not allow a separation between financial
assets, non-financial assets and liabilities of such businesses. Third, current
comparisons do not include all instruments in FA balance sheets. To cover the
entire balance sheet estimation methods for the remaining assets would need
to be created. Finally, the possibility to use administrative data sources should
be continuously pursued. These data sources are vital particularly in the
estimation of wealth held by rich households.
109 | I S I W S C 2 0 1 9