
Page 293 - Invited Paper Session (IPS) - Volume 2
P. 293
IPS246 Tiziana Laureti et al.
interpretation of confidence intervals by putting users’ attention on both lower
and upper limits.
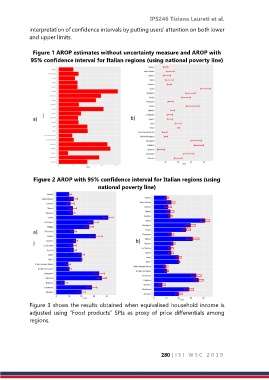
Figure 1 AROP estimates without uncertainty measure and AROP with
95% confidence interval for Italian regions (using national poverty line)
Figure 2 AROP with 95% confidence interval for Italian regions (using
national poverty line)
Figure 3 shows the results obtained when equivalised household income is
adjusted using “Food products” SPIs as proxy of price differentials among
regions.
280 | I S I W S C 2 0 1 9