
Page 294 - Invited Paper Session (IPS) - Volume 2
P. 294
IPS246 Tiziana Laureti et al.
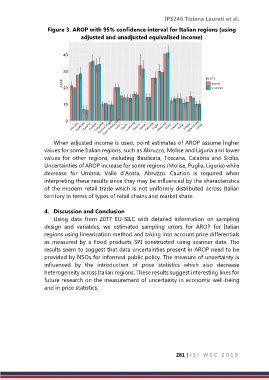
Figure 3. AROP with 95% confidence interval for Italian regions (using
adjusted and unadjusted equivalised income)
When adjusted income is used, point estimates of AROP assume higher
values for some Italian regions, such as Abruzzo, Molise and Liguria and lower
values for other regions, including Basilicata, Toscana, Calabria and Sicilia.
Uncertainties of AROP increase for some regions (Molise, Puglia, Liguria) while
decrease for Umbria, Valle d’Aosta, Abruzzo. Caution is required when
interpreting these results since they may be influenced by the characteristics
of the modern retail trade which is not uniformly distributed across Italian
territory in terms of types of retail chains and market share.
4. Discussion and Conclusion
Using data from 2017 EU-SILC with detailed information on sampling
design and variables, we estimated sampling errors for AROP for Italian
regions using linearization method and taking into account price differentials
as measured by a Food products SPI constructed using scanner data. The
results seem to suggest that data uncertainties present in AROP need to be
provided by NSOs for informed public policy. The measure of uncertainty is
influenced by the introduction of price statistics which also decrease
heterogeneity across Italian regions. These results suggest interesting lines for
future research on the measurement of uncertainty in economic well-being
and in price statistics.
281 | I S I W S C 2 0 1 9