
Page 400 - Invited Paper Session (IPS) - Volume 2
P. 400
IPS298 Renee Sorchik et al.
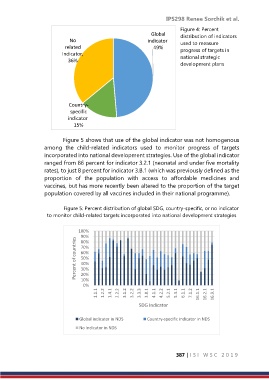
Figure 4: Percent
Global distribution of indicators
No indicator, used to measure
related 49% progress of targets in
indicator, national strategic
36%
development plans
Country-
specific
indicator,
15%
Figure 5 shows that use of the global indicator was not homogenous
among the child-related indicators used to monitor progress of targets
incorporated into national development strategies. Use of the global indicator
ranged from 86 percent for indicator 3.2.1 (neonatal and under five mortality
rates), to just 8 percent for indicator 3.B.1 (which was previously defined as the
proportion of the population with access to affordable medicines and
vaccines, but has more recently been altered to the proportion of the target
population covered by all vaccines included in their national programme).
Figure 5: Percent distribution of global SDG, country-specific, or no indicator
to monitor child-related targets incorporated into national development strategies
100%
90%
Percent of countries 70%
80%
60%
50%
40%
30%
20%
10%
0%
1.1.1 1.2.2 1.4.1 2.2.2 3.1.2 3.2.2 3.3.3 3.8.1 4.1.1 4.2.2 5.2.1 5.3.1 6.1.1 7.1.2 16.1.1 16.2.1 16.9.1
SDG Indicator
Global indicator in NDS Country-specific indicator in NDS
No indicator in NDS
387 | I S I W S C 2 0 1 9