
Page 186 - Special Topic Session (STS) - Volume 1
P. 186
STS 423 Avery S. et al.
2. Current methods and products
Frequency Layers
The U.S. national scale Crop Frequency Layers, which are derivative
products of the CDL, identify planting frequency or intensity at the 30-meter
pixel-level for corn, cotton, soybeans, and wheat. The four national-level crop
frequency layers were built and validated with ground reference data from the
FSA. These layers provide indicators for future crop planting, which is valuable
for improving agricultural survey estimates, agricultural production planning,
water resource management, natural resource allocation, and conservation
(Boryan et al., 2014a). These layers are available for visualization, analysis, and
download from CropScape.
Cultivated Layer
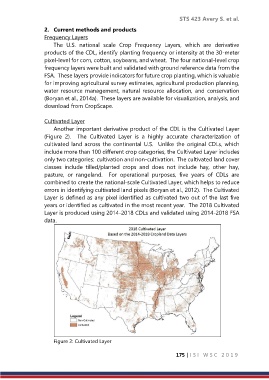
Another important derivative product of the CDL is the Cultivated Layer
(Figure 2). The Cultivated Layer is a highly accurate characterization of
cultivated land across the continental U.S. Unlike the original CDLs, which
include more than 100 different crop categories, the Cultivated Layer includes
only two categories: cultivation and non-cultivation. The cultivated land cover
classes include tilled/planted crops and does not include hay, other hay,
pasture, or rangeland. For operational purposes, five years of CDLs are
combined to create the national-scale Cultivated Layer, which helps to reduce
errors in identifying cultivated land pixels (Boryan et al., 2012). The Cultivated
Layer is defined as any pixel identified as cultivated two out of the last five
years or identified as cultivated in the most recent year. The 2018 Cultivated
Layer is produced using 2014-2018 CDLs and validated using 2014-2018 FSA
data.
Figure 2: Cultivated Layer
175 | I S I W S C 2 0 1 9