
Page 412 - Special Topic Session (STS) - Volume 2
P. 412
STS508 Suraya Ismail
but with the advent of more houses needed for the Kuala Lumpur/ Selangor
housing market, the state median multiple has crossed over the severely
unaffordable threshold. Melaka, on the other hand, has behaved as a state-
contained housing market.
While the calculated median multiples of the remaining states are shown
in Table 3, it should be noted that the figures are not reflective of the current
affordability levels of the housing markets in those states. For states that are
close to the 60% threshold, for example Pahang and Perak, upcoming housing
developments, given increased urbanisation in the states, may increase the
proportion of more formal housing in the state, making the calculated median
multiple more reflective of the housing market in the future.
Between 2002 and 2016, housing affordability has worsened for all states.
For most states, the deterioration in housing affordability occurred most
significantly between 2012 and 2014. In critical states like Negeri Sembilan and
Johor, the median house price increased at a CAGR of 36.5% and 26.2%
respectively over the stated period. By comparison, median incomes in those
states grew considerably more slowly at 7.2% and 17.7%, respectively, over the
same period.
In 2016, housing affordability improved slightly for Pulau Pinang, Kuala
Lumpur and Selangor, which saw a slight reduction in their calculated median
multiple affordability. Nevertheless, their median multiple affordability of 5.5,
4.9 and 4.7 respectively still render housing markets in these states “severely
unaffordable” and “seriously unaffordable”.
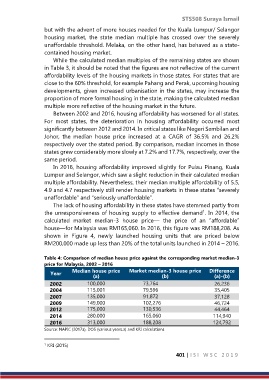
The lack of housing affordability in these states have stemmed partly from
the unresponsiveness of housing supply to effective demand . In 2014, the
1
calculated market median-3 house price— the price of an “affordable”
house—for Malaysia was RM165,060. In 2016, this figure was RM188,208. As
shown in Figure 4, newly launched housing units that are priced below
RM200,000 made up less than 20% of the total units launched in 2014 – 2016.
Table 4: Comparison of median house price against the corresponding market median-3
price for Malaysia, 2002 – 2016
Year Median house price Market median-3 house price Difference
(a)
(b)
(a)-(b)
2002 100,000 73,764 26,236
2004 115,001 79,596 35,405
2007 135,000 91,872 37,128
2009 149,000 102,276 46,724
2012 175,000 130,536 44,464
2014 280,000 165,060 114,940
2016 313,000 188,208 124,792
Source: NAPIC (2017a), DOS (various years.a) and KRI calculations
1 KRI (2015)
401 | I S I W S C 2 0 1 9