
Page 128 - Special Topic Session (STS) - Volume 3
P. 128
STS520 Xin Zheng et al.
is taken. The data from March 1 to March 11 is used as the training data size,
and the data from March 12 to March 21 is used as a testing data set. In the
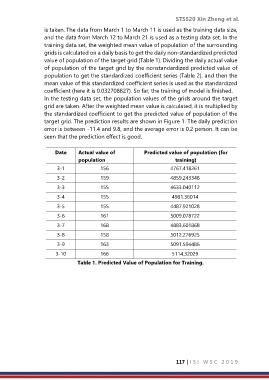
training data set, the weighted mean value of population of the surrounding
grids is calculated on a daily basis to get the daily non-standardized predicted
value of population of the target grid (Table 1). Dividing the daily actual value
of population of the target grid by the nonstandardized predicted value of
population to get the standardized coefficient series (Table 2), and then the
mean value of this standardized coefficient series is used as the standardized
coefficient (here it is 0.032708827). So far, the training of model is finished.
In the testing data set, the population values of the grids around the target
grid are taken. After the weighted mean value is calculated, it is multiplied by
the standardized coefficient to get the predicted value of population of the
target grid. The prediction results are shown in Figure 1. The daily prediction
error is between -11.4 and 9.8, and the average error is 0.2 person. It can be
seen that the prediction effect is good.
Date Actual value of Predicted value of population (for
population training)
3-1 156 4767.418261
3-2 159 4859.243348
3-3 155 4633.040112
3-4 155 4981.36014
3-5 155 4487.921028
3-6 161 5009.078722
3-7 168 4883.601868
3-8 158 5012.276925
3-9 163 5091.594486
3-10 166 5114.32029
Table 1. Predicted Value of Population for Training.
117 | I S I W S C 2 0 1 9