
Page 236 - Special Topic Session (STS) - Volume 3
P. 236
STS541 Vivian R. I.
recommendations how these data problems can be addressed. The pilot
testing was done at the national level which started with the assessment of
data describing the five (5) areas of concerns namely: availability, level of
disaggregation, source agency, and the use of disaster-related statistics. The
available data source agencies were encouraged to accomplish data
assessment based on their own way of reporting, recording, collecting, and
generating their data. This activity likewise provided an opportunity to build
capacities among agencies providing the data support to meet the
international and national statistical demand that are disaster-related and to
gauge inconsistencies of reporting between data sources.
The development of DSRF is an attempt to provide guidelines for DRR
statistics to help with the consistency in the use of different terminologies,
clarifications of the scope of measurement demands and provide different
methodological advice to improve the quality of the DRSF.
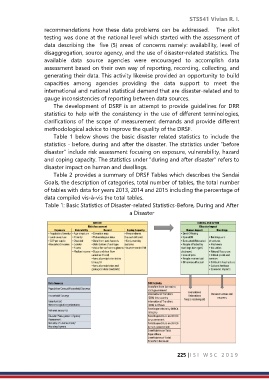
Table 1 below shows the basic disaster related statistics to include the
statistics - before, during and after the disaster. The statistics under “before
disaster” include risk assessment focusing on exposure, vulnerability, hazard
and coping capacity. The statistics under “during and after disaster” refers to
disaster impact on human and dwellings.
Table 2 provides a summary of DRSF Tables which describes the Sendai
Goals, the description of categories, total number of tables, the total number
of tables with data for years 2013, 2014 and 2015 including the percentage of
data compiled vis-à-vis the total tables.
Table 1: Basic Statistics of Disaster-related Statistics-Before, During and After
a Disaster
225 |I S I W S C 2 0 1 9