
Page 343 - Contributed Paper Session (CPS) - Volume 4
P. 343
CPS2258 Siti Norfadillah Md Saat et al.
Y = real GDP
X = number of healthcare travellers visit to Malaysia
b and = constant term
t = time trend
ε = error term.
We begin the analysis by investigate the stationarity of variables using the
Augmented Dickey-Fuller (ADF) unit root test. In addition, the optimal lag is
chosen carefully using the Akaike Information Criterion (AIC).
Unrestricted Vector Autoregressive (VAR) model is employed to determine
short run relationship between the variables before the causality test. In this
study, the Granger causality test is employed to investigate causal relationship
between economic growth and the number of healthcare travellers. Granger
introduced the concept of Granger causality in 1969 and it has been widely
used in econometrics studies to test availability and the direction of the
causality (Granger, 1969). It is also necessary to do model diagnostics, in order
to check whether the fitted model is appropriate.
4. Empirical Result and Discussion
Correlation analysis between Malaysia real GDP and healthcare travellers
shows a very strong positive relationship (r = 0.88).
4.1 Stationarity test
The ADF test for stationarity shows that healthcare travellers is stationary
at level. Meanwhile, real GDP is stationary after it is converted into the first
difference. The null hypothesis of non-stationary can be rejected when the p-
value is less than a significant level of 5 per cent. The summary of ADF is in
Table 2.
Table 2: Augmented Dickey Fuller Test Result
Variable Stationary t-stat p-value
GDP First Difference -5.094924 0.0026
Healthcare travellers Level -5.375531 0.0013
Source: Author computation
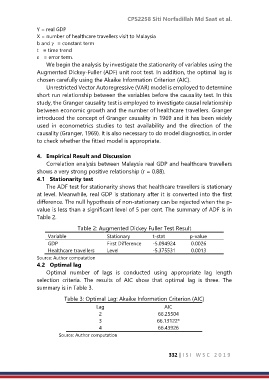
4.2 Optimal lag
Optimal number of lags is conducted using appropriate lag length
selection criteria. The results of AIC show that optimal lag is three. The
summary is in Table 3.
Table 3: Optimal Lag: Akaike Information Criterion (AIC)
Lag AIC
2 66.25504
3 66.13122*
4 66.43926
Source: Author computation
332 | I S I W S C 2 0 1 9