
Page 97 - Contributed Paper Session (CPS) - Volume 4
P. 97
CPS2132 Siti Nurliza Samsudin et al.
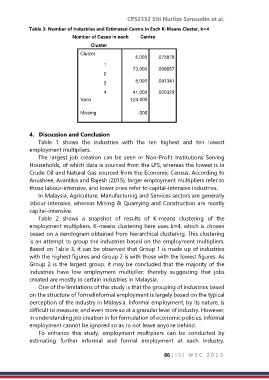
Table 3: Number of Industries and Estimated Centre in Each K-Means Cluster, k=4
Number of Cases in each Centre
Cluster
Cluster
5.000 .075878
1
73.000 .009657
2
3 5.000 .041341
4 41.000 .020329
Valid 124.000
Missing .000
4. Discussion and Conclusion
Table 1 shows the industries with the ten highest and ten lowest
employment multipliers.
The largest job creation can be seen in Non-Profit Institutions Serving
Households, of which data is sourced from the LFS, whereas the lowest is in
Crude Oil and Natural Gas sourced from the Economic Census. According to
Anushree, Avantika and Rajesh (2015), larger employment multipliers refer to
those labour-intensive, and lower ones refer to capital-intensive industries.
In Malaysia, Agriculture, Manufacturing and Services sectors are generally
labour-intensive, whereas Mining & Quarrying and Construction are mostly
capital-intensive.
Table 2 shows a snapshot of results of K-means clustering of the
employment multipliers. K-means clustering here uses k=4, which is chosen
based on a dendogram obtained from hierarchical clustering. This clustering
is an attempt to group the industries based on the employment multipliers.
Based on Table 3, it can be observed that Group 1 is made up of industries
with the highest figures and Group 2 is with those with the lowest figures. As
Group 2 is the largest group, it may be concluded that the majority of the
industries have low employment multiplier; thereby suggesting that jobs
created are mostly in certain industries in Malaysia.
One of the limitations of this study is that the grouping of industries based
on the structure of formalinformal employment is largely based on the typical
perception of the industry in Malaysia. Informal employment, by its nature, is
difficult to measure; and even more so at a granular level of industry. However,
in understanding job creation in for formulation of economic policies, informal
employment cannot be ignored so as to not leave anyone behind.
To enhance this study, employment multipliers can be conducted by
estimating further informal and formal employment at each industry.
86 | I S I W S C 2 0 1 9