
Page 101 - Contributed Paper Session (CPS) - Volume 4
P. 101
CPS2134 Yutaka Kuroki et al.
Generalized Method of Moment (GMM). GMM has become an important
estimation procedure in applied economics and finance since Hansen (1982)
introduce. Finally, we confirm the validity of our model and proposed
fundamental factors in retail demand series.
The rest of paper is organized as follows. Section 2 describes data and our
proposed model. The proposed fundamental factors in restaurant visitor data
are also introduced in Section 2. Section 3 shows estimation results of the
multiple regression models together with the results of the tests of the model
assumptions. Section 4 provides summary and discussions of our results.
2. Data and Fundamental Factors in Retail Demand
The number of customers for Japanese restaurants were recorded by using
AirREGI systems of Recruit Holdings, where AirREGI provides a free POS cash-
register service. The data were available from Kaggle Recruit restaurant visitor
1
forecasting competitions . The data consists of number of visitors for 795
nd
st
restaurants in Japan from the period 1 January 2016 to 22 April 2017. Area
covered all major cities in Japan, including Sapporo, Tokyo, Osaka, Fukuoka,
and so on. The genres or styles of the restaurants are divided into 14
categories, e.g., Japanese food, Italian/French, and Café/Sweets, and so on.
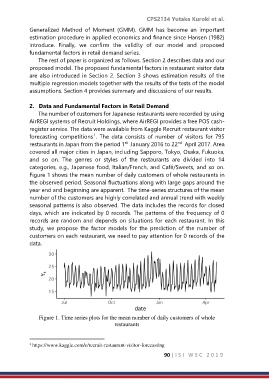
Figure 1 shows the mean number of daily customers of whole restaurants in
the observed period. Seasonal fluctuations along with large gaps around the
year end and beginning are apparent. The time-series structures of the mean
number of the customers are highly correlated and annual trend with weekly
seasonal patterns is also observed. The data includes the records for closed
days, which are indicated by 0 records. The patterns of the frequency of 0
records are random and depends on situations for each restaurant. In this
study, we propose the factor models for the prediction of the number of
customers on each restaurant, we need to pay attention for 0 records of the
data.
Figure 1. Time series plots for the mean number of daily customers of whole
restaurants
1 https://www.kaggle.com/c/recruit-restaurant-visitor-forecasting
90 | I S I W S C 2 0 1 9