
Page 133 - Contributed Paper Session (CPS) - Volume 7
P. 133
CPS2047 Kamaruzaman Mohamed et al.
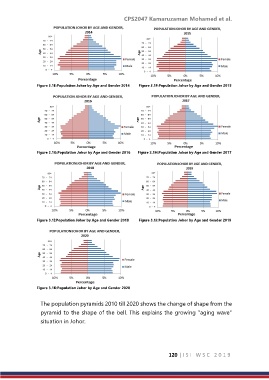
Figure 3.1E:Population Johor by Age and Gender 2014 Figure 3.1F:Population Johor by Age and Gender 2015
Figure 3.1G:Population Johor by Age and Gender 2016 Figure 3.1H:Population Johor by Age and Gender 2017
Figure 3.1I:Population Johor by Age and Gender 2018 Figure 3.1J:Population Johor by Age and Gender 2019
Figure 3.1K:Population Johor by Age and Gender 2020
The population pyramids 2010 till 2020 shows the change of shape from the
pyramid to the shape of the bell. This explains the growing "aging wave"
situation in Johor.
120 | I S I W S C 2 0 1 9