
Page 225 - Contributed Paper Session (CPS) - Volume 7
P. 225
CPS2068 Jan-Philipp Kolb et al.
positive rate (FPR) at various threshold settings. It is possible to calculate an
indicator (ROC‐AUC) for that curve, and the values for this indicator are also
bounded between zero and one. Values over .5 indicate that the used methods
perform better than flipping a coin.
The sensitivity (Sens) also called the true positive rate (TPR) measures the
proportion of actual positives that are correctly identified as such. As we have
many more respondents than non‐respondents, the values for this sensitivity
indicator are very close to one in our case.
Specificity (Spec) is also called the true negative rate. It measures the
percentage of real negatives that are correctly identified as such. Here the
performance varies for the statistical learning techniques.
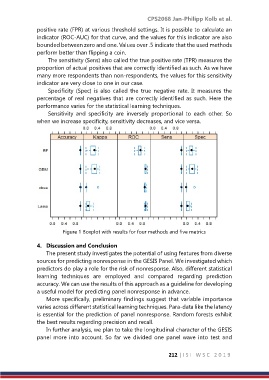
Sensitivity and specificity are inversely proportional to each other. So
when we increase specificity, sensitivity decreases, and vice versa.
Figure 1 Boxplot with results for four methods and five metrics
4. Discussion and Conclusion
The present study investigates the potential of using features from diverse
sources for predicting nonresponse in the GESIS Panel. We investigated which
predictors do play a role for the risk of nonresponse. Also, different statistical
learning techniques are employed and compared regarding prediction
accuracy. We can use the results of this approach as a guideline for developing
a useful model for predicting panel nonresponse in advance.
More specifically, preliminary findings suggest that variable importance
varies across different statistical learning techniques. Para-data like the latency
is essential for the prediction of panel nonresponse. Random forests exhibit
the best results regarding precision and recall.
In further analysis, we plan to take the longitudinal character of the GESIS
panel more into account. So far we divided one panel wave into test and
212 | I S I W S C 2 0 1 9