
Page 241 - Contributed Paper Session (CPS) - Volume 7
P. 241
CPS2073 Alban Çela et al.
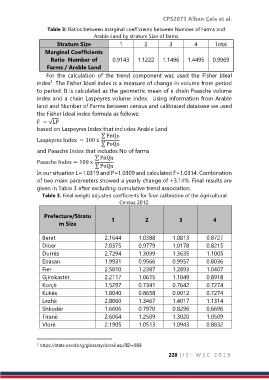
Table 3: Ratios between marginal coefficients between Number of Farms and
Arable Land by stratum Size of farms
Stratum Size 1 2 3 4 Total
Marginal Coefficients
Ratio Number of 0.9143 1.1222 1.1496 1.4495 0.9969
Farms / Arable Land
For the calculation of the trend component was used the Fisher Ideal
index . The Fisher Ideal index is a measure of change in volume from period
2
to period. It is calculated as the geometric mean of a chain Paasche volume
index and a chain Laspeyres volume index. Using information from Arable
land and Number of Farms between census and calibrated database we used
the Fisher Ideal index formula as follows:
F = √LP
based on Laspeyres Index that includes Arable Land
∑ PnQo
Laspeyres Index = 100 x
∑ PoQo
and Paasche Index that includes No of farms
∑ PnQn
Paasche Index = 100 x
∑ PoQn
In our situation L=1.0319 and P=1.0309 and calculated F=1.0314. Combination
of two main parameters showed a yearly change of +3.14%. Final results are
given in Table 3 after excluding cumulative trend association.
Table 3. Final weight adjusted coefficients for final calibration of the Agricultural
Census 2012.
Prefecture/Stratu
m Size 1 2 3 4
Berat 2.1644 1.0388 1.0813 0.8727
Dibër 2.0375 0.9779 1.0178 0.8215
Durrës 2.7294 1.3099 1.3635 1.1005
Ebasan 1.9931 0.9566 0.9957 0.8036
Fier 2.5810 1.2387 1.2893 1.0407
Gjirokastër 2.2117 1.0615 1.1049 0.8918
Korçë 1.5297 0.7341 0.7642 0.7274
Kukës 1.8040 0.8658 0.9012 0.7274
Lezhë 2.8060 1.3467 1.4017 1.1314
Shkodër 1.6606 0.7970 0.8296 0.6696
Tiranë 2.6064 1.2509 1.3020 1.0509
Vlorë 2.1905 1.0513 1.0943 0.8832
2 https://stats.oecd.org/glossary/detail.asp?ID=989
228 | I S I W S C 2 0 1 9