
Page 246 - Contributed Paper Session (CPS) - Volume 7
P. 246
CPS2075 Wan Siti Zaleha W. Z. et al.
series. This study used Granger causality test to examine the existence of
short‐run relationship between the pairs of variables under study.
3. Result
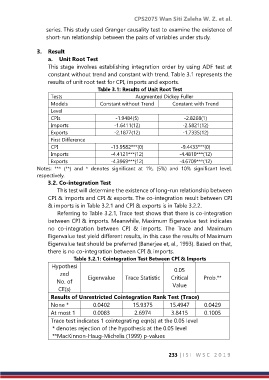
a. Unit Root Test
This stage involves establishing integration order by using ADF test at
constant without trend and constant with trend. Table 3.1 represents the
results of unit root test for CPI, imports and exports.
Table 3.1: Results of Unit Root Test
Tests Augmented Dickey Fuller
Models Constant without Trend Constant with Trend
Level
CPIs -1.9484(5) -2.8268(1)
Imports -1.6411(12) -2.5821(12)
Exports -2.1877(12) -1.7335(12)
First Difference
CPI -13.9582***(0) -9.4433***(0)
Imports -4.4121***(12) -4.4810***(12)
Exports -4.3969***(12) -4.6709***(12)
Notes: *** (**) and * denotes significant at 1%, (5%) and 10% significant level,
respectively.
3.2. Co-integration Test
This test will determine the existence of long‐run relationship between
CPI & imports and CPI & exports. The co‐integration result between CPI
& imports is in Table 3.2.1 and CPI & exports is in Table 3.2.2.
Referring to Table 3.2.1, Trace test shows that there is co‐integration
between CPI & imports. Meanwhile, Maximum Eigenvalue test indicates
no co‐integration between CPI & imports. The Trace and Maximum
Eigenvalue test yield different results, in this case the results of Maximum
Eigenvalue test should be preferred (Banerjee et, al., 1993). Based on that,
there is no co‐integration between CPI & imports.
Table 3.2.1: Cointegration Test Between CPI & Imports
Hypothesi
0.05
zed Eigenvalue Trace Statistic Critical Prob.**
No. of Value
CE(s)
Results of Unrestricted Cointegration Rank Test (Trace)
None * 0.0402 15.9375 15.4947 0.0429
At most 1 0.0083 2.6974 3.8415 0.1005
Trace test indicates 1 cointegrating eqn(s) at the 0.05 level
* denotes rejection of the hypothesis at the 0.05 level
**MacKinnon-Haug-Michelis (1999) p-values
233 | I S I W S C 2 0 1 9