
Page 284 - Contributed Paper Session (CPS) - Volume 7
P. 284
CPS2099 Takatsugu Yoshioka et al.
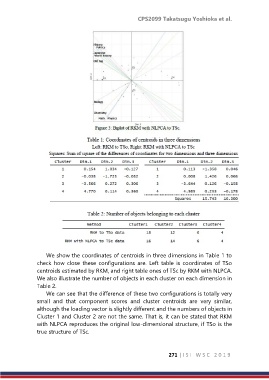
We show the coordinates of centroids in three dimensions in Table 1 to
check how close these configurations are. Left table is coordinates of TSo
centroids estimated by RKM, and right table ones of TSc by RKM with NLPCA.
We also illustrate the number of objects in each cluster on each dimension in
Table 2.
We can see that the difference of these two configurations is totally very
small and that component scores and cluster centroids are very similar,
although the loading vector is slightly different and the numbers of objects in
Cluster 1 and Cluster 2 are not the same. That is, it can be stated that RKM
with NLPCA reproduces the original low-dimensional structure, if TSo is the
true structure of TSc.
271 | I S I W S C 2 0 1 9