
Page 282 - Contributed Paper Session (CPS) - Volume 7
P. 282
CPS2099 Takatsugu Yoshioka et al.
[Step2] Quantification: Quantify (+1) by PRICIPALS and obtain quantified
data matrix ∗() .
[Step 3] Clustering: Minimize (3) to estimate the cluster allocations and
()
centroids by -means algorithm (obtain () , () and ).
[Step 4]Termination: Compute the difference between the current (-th) value
of loss function (3) and the previous ((-1)-th) value of loss function (3). If it is
sufficiently small or the maximum number of iterations has been reached,
stop. Otherwise, set =+1 and go back to Step 2.
3. Result
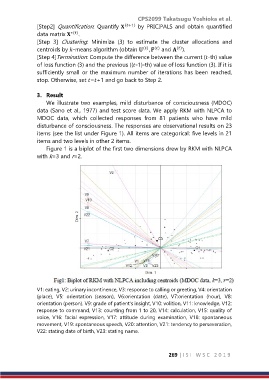
We illustrate two examples, mild disturbance of consciousness (MDOC)
data (Sano et al., 1977) and test score data. We apply RKM with NLPCA to
MDOC data, which collected responses from 81 patients who have mild
disturbance of consciousness. The responses are observational results on 23
items (see the list under Figure 1). All items are categorical: five levels in 21
items and two levels in other 2 items.
Figure 1 is a biplot of the first two dimensions drew by RKM with NLPCA
with k=3 and r=2.
V1: eating, V2: urinary incontinence, V3: response to calling or greeting, V4: orientation
(place), V5: orientation (season), V6:orientation (date), V7:orientation (hour), V8:
orientation (person). V9: grade of patient’s insight, V10: volition, V11: knowledge, V12:
response to command, V13: counting from 1 to 20, V14: calculation, V15: quality of
voice, V16: facial expression, V17: attitude during examination, V18: spontaneous
movement, V19: spontaneous speech, V20: attention, V21: tendency to perseveration,
V22: stating date of birth, V23: stating name.
269 | I S I W S C 2 0 1 9