
Page 294 - Contributed Paper Session (CPS) - Volume 7
P. 294
CPS2103 Helda Curma et al.
the quality dimensions, as specified in the European statistics Code of
Practice, impacted from the received assistance;
standardisation initiatives undertaken by NSOs, as defined by the
UNECE, High-Level Group for the Modernisation of Official Statistics;
the extent collaboration with international institutions improved the
positioning of the National Statistical Offices and areas where support
is needed in the near future.
The three sets of factors , stated in the European statistics Code of Practice
1
and also on the Albanian law on Official Statistics, underlying trust in official
statistics measured in this paper were evaluate from 1 to 5(1 – Strongly
disagree,2 – Disagree, 3 – Neither agree or disagree, 4 – Agree and 5 – Strongly
agree) and they are as follow:
a. Structural factors, including the extent to which the statistics are, or
are perceived as being, objective and independent, impartial, non-
partisan and transparent.
b. Statistical factors (including sound statistical processes and quality
outputs);
c. Reputational factors which in turn are affected by a number of
national practices and considerations: a commitment to informing
the public, through the provision of relevant statistics, about major
issues of national importance; regular consultation processes;
relationship with the media and other key stakeholders; past
incidents of erroneous data or unethical behaviour; the
preparedness of the agency to openly correct or address misleading
or inaccurate media reports; etc.
National Statistical Offices Survey Results
The statistical office opinion has been measured and user perception
regarding the three sets of factors (Structural factors, Statistical factors and
Reputational factors) underlying trust in official statistics. In the figure 1 are
shown the results of the user perception and statistical office opinion for the
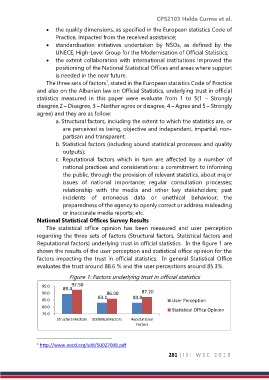
factors impacting the trust in official statistics. In general Statistical Office
evaluates the trust around 88.6 % and the user perceptions around 85.3%.
Figure 1: Factors underlying trust in official statistics
95.0 92.50
89.4
90.0 86.00 87.20
83.1 83.0
85.0 User Perception
80.0
Statistical Office Opinion
75.0
Structural Factors Statistical Factors Reputational
Factors
1 http://www.oecd.org/sdd/50027008.pdf
281 | I S I W S C 2 0 1 9