
Page 369 - Contributed Paper Session (CPS) - Volume 7
P. 369
CPS2133 Alexander Schnurr et al.
transformation does not affect our results. In the given data set, one often
finds consecutive data points having an equal value. This yields a certain
ordinal pattern, for example Π(810,810, 810) = (2,1,0) in the case = 3 by the
convention (ii) above. In our case this would distort the results. We hence
disturbed the data with a small white noise process with standard deviation
0.01 to avoid this case. In a way this is natural, since the data has not been
measured accurately and the ties are a result of rounding rather than being
real ties.
First we ran a Dickey-Fuller test for stationarity implemented in GNU R to
justify our assumption of stationarity for both data sets (all-year and only-
winter). After that we estimated the Hurst parameter, which describes the
degree of dependence within a time series, with an estimator implemented
also in GNU R (‘hurstexp’). If ∈ (0.5,1) the time series exhibits long-range
dependent, if < 0.5 it is short-range dependent. In the all-year data, we
obtained = 0.72 and in the winter data, for all 197 years, we got values
between 0.7528 and 0.7979 with mean 0.7528, so the conjecture of long-range
dependence of the given data is satisfied.
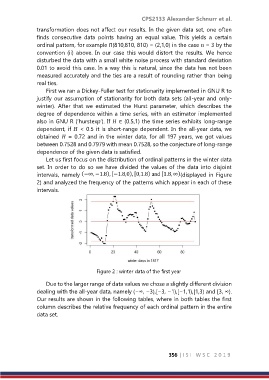
Let us first focus on the distribution of ordinal patterns in the winter data
set. In order to do so we have divided the values of the data into disjoint
intervals, namely (displayed in Figure
2) and analyzed the frequency of the patterns which appear in each of these
intervals.
Figure 2 : winter data of the first year
Due to the larger range of data values we chose a slightly different division
dealing with the all-year data, namely (−∞, −3),[−3, −1),[−1,1),[1,3) and [3, ∞).
Our results are shown in the following tables, where in both tables the first
column describes the relative frequency of each ordinal pattern in the entire
data set.
356 | I S I W S C 2 0 1 9