
Page 151 - Contributed Paper Session (CPS) - Volume 6
P. 151
CPS1851 Hee Young Chung et al.
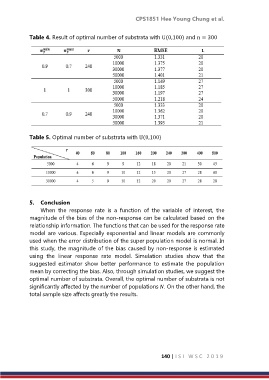
Table 4. Result of optimal number of substrata with U(0,100) and n = 300
Table 5. Optimal number of substrata with U(0,100)
5. Conclusion
When the response rate is a function of the variable of interest, the
magnitude of the bias of the non-response can be calculated based on the
relationship information. The functions that can be used for the response rate
model are various. Especially exponential and linear models are commonly
used when the error distribution of the super population model is normal. In
this study, the magnitude of the bias caused by non-response is estimated
using the linear response rate model. Simulation studies show that the
suggested estimator show better performance to estimate the population
mean by correcting the bias. Also, through simulation studies, we suggest the
optimal number of substrata. Overall, the optimal number of substrata is not
significantly affected by the number of populations . On the other hand, the
total sample size affects greatly the results.
140 | I S I W S C 2 0 1 9