
Page 35 - Contributed Paper Session (CPS) - Volume 6
P. 35
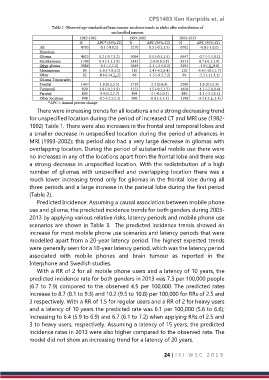
CPS1483 Ken Karipidis et. al


               There were increasing trends for all locations and a strong decreasing trend
            for unspecified location during the period of increased CT and MRI use (1982-
            1992) Table 1. There were also increases in the frontal and temporal lobes and
            a smaller decrease in unspecified location during the period of advances in
            MRI (1993-2002); this period also had a very large decrease in gliomas with
            overlapping location. During the period of substantial mobile use there were
            no increases in any of the locations apart from the frontal lobe and there was
            a strong decrease in unspecified location. With the redistribution of a high
            number  of  gliomas  with  unspecified  and  overlapping  location  there  was  a
            much lower increasing trend only for gliomas in the frontal lobe during all
            three periods and a large increase in the parietal lobe during the first period
            (Table 2).
               Predicted Incidence: Assuming a causal association between mobile phone
            use and glioma, the predicted incidence trends for both genders during 2003-
            2013 by applying various relative risks, latency periods and mobile phone use
            scenarios are shown in Table 3.  The predicted incidence trends showed an
            increase for most mobile phone use scenarios and latency periods that were
            modelled apart from a 20-year latency period. The highest expected trends
            were generally seen for a 10-year latency period, which was the latency period
            associated  with  mobile  phones  and  brain  tumour  as  reported  in  the
            Interphone and Swedish studies.
               With a RR of 2 for all mobile phone users and a latency of 10 years, the
            predicted incidence rate for both genders in 2013 was 7.3 per 100,000 people
            (6.7 to 7.9) compared to the observed 4.5 per 100,000. The predicted rates
            increase to 8.7 (8.1 to 9.3) and 10.2 (9.5 to 10.8) per 100,000 for RRs of 2.5 and
            3 respectively. With a RR of 1.5 for regular users and a RR of 2 for heavy users
            and a latency of 10 years the predicted rate was 6.1 per 100,000 (5.6 to 6.6);
            increasing to 6.4 (5.9 to 6.9) and 6.7 (6.1 to 7.2) when applying RRs of 2.5 and
            3 to heavy users, respectively. Assuming a latency of 15 years, the predicted
            incidence rates in 2013 were also higher compared to the observed rate. The
            model did not show an increasing trend for a latency of 20 years.


                                                                24 | I S I   W S C   2 0 1 9