
Page 370 - Contributed Paper Session (CPS) - Volume 6
P. 370
CPS1969 Janna M. De Veyra
variable. Ratio of source A to source B that will be considered are 50-50, 70-
30, and 90-10.
3. Result
The performance of the procedures for testing independence will be evaluated
by the size and power of the test. For the purpose of this study, a test will be
considered as correctly sized when the computed size is at most 0.05.
Discussions of the analysis will be divided into sections concerning the number
of categories of the variables being matched.
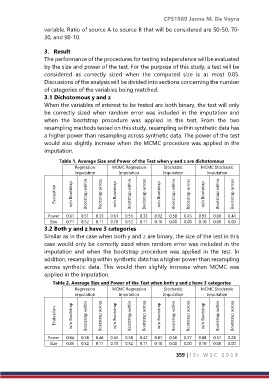
3.1 Dichotomous y and z
When the variables of interest to be tested are both binary, the test will only
be correctly sized when random error was included in the imputation and
when the bootstrap procedure was applied in the test. From the two
resampling methods tested on this study, resampling within synthetic data has
a higher power than resampling across synthetic data. The power of the test
would also slightly increase when the MCMC procedure was applied in the
imputation.
Table 1. Average Size and Power of the Test when y and z are dichotomous
Regression MCMC Regression Stochastic MCMC Stochastic
Imputation Imputation Imputation Imputation
Evaluation w/o Bootstrap Bootstrap within Bootstrap across w/o Bootstrap Bootstrap within Bootstrap across w/o Bootstrap Bootstrap within Bootstrap across w/o Bootstrap Bootstrap within Bootstrap across
Power 0.61 0.51 0.33 0.61 0.51 0.33 0.92 0.58 0.43 0.93 0.60 0.44
Size 0.71 0.52 0.11 0.70 0.52 0.11 0.10 0.00 0.00 0.10 0.00 0.00
3.2 Both y and z have 3 categories
Similar as in the case when both y and z are binary, the size of the test in this
case would only be correctly sized when random error was included in the
imputation and when the bootstrap procedure was applied in the test. In
addition, resampling within synthetic data has a higher power than resampling
across synthetic data. This would then slightly increase when MCMC was
applied in the imputation.
Table 2. Average Size and Power of the Test when both y and z have 3 categories
Regression MCMC Regression Stochastic MCMC Stochastic
Imputation Imputation Imputation Imputation
Evaluation w/o Bootstrap Bootstrap within Bootstrap across w/o Bootstrap Bootstrap within Bootstrap across w/o Bootstrap Bootstrap within Bootstrap across w/o Bootstrap Bootstrap within Bootstrap across
Power 0.64 0.58 0.46 0.65 0.58 0.47 0.87 0.56 0.27 0.88 0.57 0.28
Size 0.85 0.52 0.11 0.70 0.52 0.11 0.10 0.00 0.00 0.10 0.00 0.00
359 | I S I W S C 2 0 1 9