
Page 383 - Contributed Paper Session (CPS) - Volume 6
P. 383
CPS1992 Epimaco A. Cabanlit, Jr. et al.
alternative which exhibit a better fit for failure data and provides more
appropriate information about reliability and hazard rates (Meniconi, M. and
Parry, D.M. ,1996).
Several authors have reported characterization of the PFD based on order
statistics and records. One of these authors was Rider (1964) who first derived
the distribution of the product and ratio of the order statistics from a power
function distribution(Rider, P.R.,1966 ). Another, Ahsanullah (1973) defined
necessary and sufficient conditions based on PFD order statistics. Also, Kabir
and Ahsanullah (1975) discussed the estimation of the location and scale
parameters of a power function distribution. And Moothathu (1884) gave
characterizations of the PFD through Lorenz curve.
In probability theory and statistics, the power function distribution is a
continuous probability distribution. It is a flexible lifetime model which can be
obtained from the Pareto model and it is also a special case of the beta
distribution (Dallas, A.C.,1978).
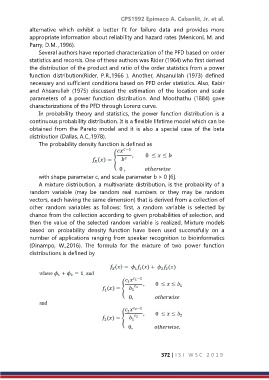
The probability density function is defined as
with shape parameter c, and scale parameter b > 0 [6].
A mixture distribution, a multivariate distribution, is the probability of a
random variable (may be random real numbers or they may be random
vectors, each having the same dimension) that is derived from a collection of
other random variables as follows: first, a random variable is selected by
chance from the collection according to given probabilities of selection, and
then the value of the selected random variable is realized. Mixture models
based on probability density function have been used successfully on a
number of applications ranging from speaker recognition to bioinformatics
(Dinampo, W.,2016). The formula for the mixture of two power function
distributions is defined by
372 | I S I W S C 2 0 1 9