
Page 128 - Invited Paper Session (IPS) - Volume 1
P. 128
IPS102 Peter V. et al.
households, a major issue concerns the way in which the statistical gaps
between the micro-data and the equivalent national accounts aggregates
are allocated to the various household groupings, as this will directly affect
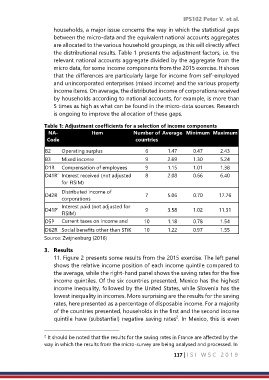
the distributional results. Table 1 presents the adjustment factors, i.e. the
relevant national accounts aggregate divided by the aggregate from the
micro data, for some income components from the 2015 exercise. It shows
that the differences are particularly large for income from self-employed
and unincorporated enterprises (mixed income) and the various property
income items. On average, the distributed income of corporations received
by households according to national accounts, for example, is more than
5 times as high as what can be found in the micro-data sources. Research
is ongoing to improve the allocation of these gaps.
Table 1: Adjustment coefficients for a selection of income components
NA- Item Number of Average Minimum Maximum
Code countries
B2 Operating surplus 6 1.47 0.47 2.43
B3 Mixed income 9 2.69 1.30 5.24
D1R Compensation of employees 9 1.15 1.01 1.38
D41R’ Interest received (not adjusted 8 2.08 0.66 6.40
for FISIM)
Distributed income of
D42R 7 5.06 0.70 17.76
corporations
Interest paid (not adjusted for
D41P’ 9 3.58 1.02 11.31
FISIM)
D5P Current taxes on income and 10 1.18 0.78 1.54
wealth
D62R Social benefits other than STiK 10 1.22 0.97 1.55
Source: Zwijnenburg (2016)
3. Results
11. Figure 2 presents some results from the 2015 exercise. The left panel
shows the relative income position of each income quintile compared to
the average, while the right-hand panel shows the saving rates for the five
income quintiles. Of the six countries presented, Mexico has the highest
income inequality, followed by the United States, while Slovenia has the
lowest inequality in incomes. More surprising are the results for the saving
rates, here presented as a percentage of disposable income. For a majority
of the countries presented, households in the first and the second income
2
quintile have (substantial) negative saving rates . In Mexico, this is even
2 It should be noted that the results for the saving rates in France are affected by the
way in which the results from the micro-survey are being analysed and processed. In
117 | I S I W S C 2 0 1 9