
Page 129 - Invited Paper Session (IPS) - Volume 1
P. 129
IPS102 Peter V. et al.
true for all income quintiles, except the highest income group. More
detailed results can be found in Zwijnenburg et al. (2017).
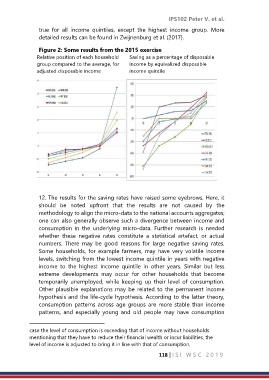
Figure 2: Some results from the 2015 exercise
Relative position of each household Saving as a percentage of disposable
group compared to the average, for income by equivalized disposable
adjusted disposable income income quintile
12. The results for the saving rates have raised some eyebrows. Here, it
should be noted upfront that the results are not caused by the
methodology to align the micro-data to the national accounts aggregates;
one can also generally observe such a divergence between income and
consumption in the underlying micro-data. Further research is needed
whether these negative rates constitute a statistical artefact, or actual
numbers. There may be good reasons for large negative saving rates.
Some households, for example farmers, may have very volatile income
levels, switching from the lowest income quintile in years with negative
income to the highest income quintile in other years. Similar but less
extreme developments may occur for other households that become
temporarily unemployed, while keeping up their level of consumption.
Other plausible explanations may be related to the permanent income
hypothesis and the life-cycle hypothesis. According to the latter theory,
consumption patterns across age groups are more stable than income
patterns, and especially young and old people may have consumption
case the level of consumption is exceeding that of income without households
mentioning that they have to reduce their financial wealth or incur liabilities, the
level of income is adjusted to bring it in line with that of consumption.
118 | I S I W S C 2 0 1 9