
Page 22 - Invited Paper Session (IPS) - Volume 2
P. 22
IPS178 Sana Antoine S. J.
increase in the price of oil leads to an increase of 0.065% in inflation, a very
strong result given the highly volatile nature of the Brent price level.
In addition to the headline CPI, we performed the same regression on a
measure of the “core CPI” which excludes Food and Energy items. Such
regression allows us to check that, when considering the core CPI measure,
the impact of external variables is reduced.
Coefficients:
Estimate Std. Error t value Pr(>|t|)
(Intercept) 0.016152 0.004957 3.258 0.00148 **
diff(log(m3), lag = 12) 0.104585 0.054642 1.914 0.05813 .
diff(log(wair), lag = 12) 0.074915 0.030839 2.429 0.01669 *
diff(log(brent), lag = 12) 0.045214 0.005968 7.576 1.02e-11 ***
diff(log(exr), lag = 12) -0.027909 0.025065 -1.113 0.26784
dummy 0.069336 0.005625 12.326 < 2e-16 ***
---
Signif. codes: 0 ‘***’ 0.001 ‘**’ 0.01 ‘*’ 0.05 ‘.’ 0.1 ‘ ’ 1
Residual standard error: 0.01825 on 114 degrees of freedom
Multiple R-squared: 0.6828, Adjusted R-squared: 0.6689
F-statistic: 49.08 on 5 and 114 DF, p-value: < 2.2e-16
As expected, the elasticity of Brent decreases to 0.045 but this variable
remains very significant proving that the exclusion of the Food and Energy
items is not enough to eliminate the indirect effects of oil prices. Furthermore,
we notice that the coefficients for interest rates and money supply become
significant at the 5% and 10% levels respectively. In addition to that, their
elasticities are higher than the ones found for headline inflation meaning that
core inflation reflects more distinctly the impact of monetary policy than
headline inflation.
Measure Headline Core 3 (excl. food & energy)
Δ(log(M3)) 0.3 % 0.4 %
Δ (log(WAIR)) 0.1 % 0.9 %
Dummy 26.6 % 41.8 %
Δ(log(Brent)) 31.5 % 20.3 %
Δ(log(EXR)) 7.2% 4.9 %
Table 1: LMG measure of relative importance
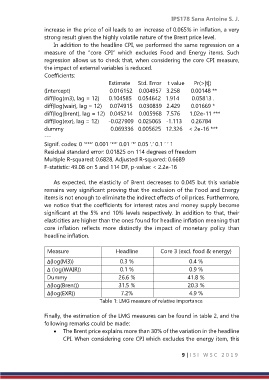
Finally, the estimation of the LMG measures can be found in table 2, and the
following remarks could be made:
The Brent price explains more than 30% of the variation in the headline
CPI. When considering core CPI which excludes the energy item, this
9 | I S I W S C 2 0 1 9