
Page 168 - Special Topic Session (STS) - Volume 1
P. 168
STS 422 Zarina A.R
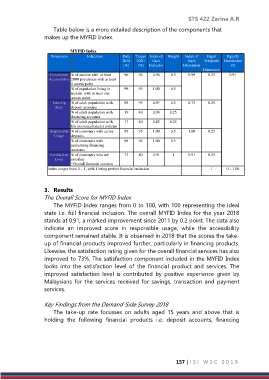
Table below is a more detailed description of the components that
makes up the MYFID Index.
MYFID Index
Dimension Indicators Data Target Index of Weight Index of Equal Equally
2018 2020 Each Each Weighted Distributed
(%) (%) Indicator Dimension FII
Dimension
Convenient % of mukim with at least 96 98 0.98 0.5 0.99 0.25 0.91
Accessibility 2000 population with at least
1 access point
% of population living in 99 99 1.00 0.5
mukim with at least one
access point
Take-Up % of adult population with 92 95 0.97 0.5 0.73 0.25
Rate deposit accounts
% of adult population with 39 40 0.98 0.25
financing accounts
% of adult population with 17 40 0.43 0.25
life insurance/takaful policies
Responsible % of customers with active 95 95 1.00 0.5 1.00 0.25
Usage deposits
% of customers with 98 98 1.00 0.5
performing financing
accounts
Satisfaction % of customers who are 73 80 0.91 1 0.91 0.25
Level satisfied
−Overall financial services
Index ranges from 0 – 1, with 1 being perfect financial inclusion 1 0 – 1.00
3. Results
The Overall Score for MYFID Index
The MYFID Index ranges from 0 to 100, with 100 representing the ideal
state i.e. full financial inclusion. The overall MYFID Index for the year 2018
stands at 0.91, a marked improvement since 2011 by 0.2 point. The data also
indicate an improved score in responsible usage, while the accessibility
component remained stable. It is observed in 2018 that the scores the take-
up of financial products improved further, particularly in financing products.
Likewise, the satisfaction rating given for the overall financial services has also
improved to 73%. The satisfaction component included in the MYFID Index
looks into the satisfaction level of the financial product and services. The
improved satisfaction level is contributed by positive experience given by
Malaysians for the services received for savings, transaction and payment
services.
Key Findings from the Demand-Side Survey 2018
The take-up rate focusses on adults aged 15 years and above that is
holding the following financial products i.e. deposit accounts, financing
157 | I S I W S C 2 0 1 9