
Page 215 - Special Topic Session (STS) - Volume 1
P. 215
STS425 Nur I. et al.
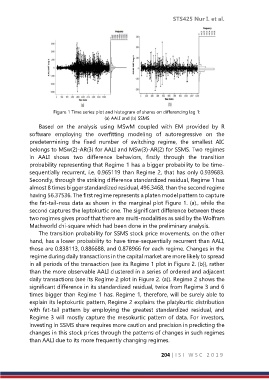
Figure 1 Time series plot and histogram of shares on differencing lag 1:
(a) AALI and (b) SSMS
Based on the analysis using MSwM coupled with EM provided by R
software employing the overfitting modeling of autoregressive on the
predetermining the fixed number of switching regime, the smallest AIC
belongs to MSw(2)-AR(3) for AALI and MSw(3)-AR(2) for SSMS. Two regimes
in AALI shows two difference behaviors, firstly through the transition
probability representing that Regime 1 has a bigger probability to be time-
sequentially recurrent, i.e. 0.965119 than Regime 2, that has only 0.939683.
Secondly, through the striking difference standardized residual, Regime 1 has
almost 8 times bigger standardized residual, 496.3468, than the second regime
having 56.37536. The first regime represents a platen model pattern to capture
the fat-tail-ness data as shown in the marginal plot Figure 1. (a)., while the
second captures the leptokurtic one. The significant difference between these
two regimes gives proof that there are multi-modalities as said by the Wolfram
Mathworld chi-square which had been done in the preliminary analysis.
The transition probability for SSMS stock price movements, on the other
hand, has a lower probability to have time-sequentially recurrent than AALI,
those are 0.838113, 0.886688, and 0.878966 for each regime. Changes in the
regime during daily transactions in the capital market are more likely to spread
in all periods of the transaction (see its Regime 1 plot in Figure 2. (b)), rather
than the more observable AALI clustered in a series of ordered and adjacent
daily transactions (see its Regime 2 plot in Figure 2. (a)). Regime 2 shows the
significant difference in its standardized residual, twice from Regime 3 and 6
times bigger than Regime 1 has. Regime 1, therefore, will be surely able to
explain its leptokurtic pattern, Regime 2 explains the platykurtic distribution
with fat-tail pattern by employing the greatest standardized residual, and
Regime 3 will mostly capture the mesokurtic pattern of data. For investors,
investing in SSMS share requires more caution and precision in predicting the
changes in this stock prices through the patterns of changes in such regimes
than AALI due to its more frequently changing regimes.
204 | I S I W S C 2 0 1 9