Page 324 - Special Topic Session (STS) - Volume 1
P. 324

STS441 Andrea N.
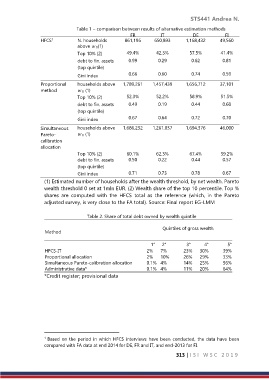
                              Table 1 – comparison between results of alternative estimation methods
                                                   FR          IT          DE          FI
                     1
                 HFCS          N. households     861,196    650,893     1,168,432    49,560
                               above w  0(1)
                               Top 10% (2)        49.4%      42.3%        57.5%       41.4%
                               debt to fin. assets   0.99     0.29        0.62        0.81
                               (top quintile)
                               Gini index         0.66        0.60        0.74        0.59
                 Proportional   households above   1,789,261   1,457,439   1,656,712   37,101
                 method        w  0 (1)
                               Top 10% (2)        52.3%      52.2%        58.9%       51.5%
                               debt to fin. assets   0.49     0.19        0.44        0.60
                               (top quintile)
                               Gini index         0.67        0.64        0.72        0.70

                 Simultaneous   households above   1,686,232   1,261,837   1,694,376   46,000
                 Pareto-       w  0 (1)
                 calibration
                 allocation
                               Top 10% (2)        60.1%      62.3%        67.4%       39.2%
                               debt to fin. assets   0.50     0.22        0.44        0.57
                               (top quintile)
                               Gini index         0.71        0.73        0.78        0.67
                  (1) Estimated number of households after the wealth threshold, by net wealth. Pareto
                  wealth threshold 0 set at 1mln EUR. (2) Wealth share of the top 10 percentile. Top %
                  shares  are  computed  with  the  HFCS  total  as  the  reference  (which,  in  the  Pareto
                  adjusted survey, is very close to the FA total). Source: Final report EG-LMM

                                  Table 2. Share of total debt owned by wealth quintile

                                                               Quintiles of gross wealth
                  Method

                                                           1°   2°       3°    4°       5°
                  HFCS-IT                                2%    7%      23%    30%      39%
                  Proportional allocation                2%    10%     26%    29%      33%
                  Simultaneous Pareto-calibration allocation   0.1%  4%   14%   25%    56%
                  Administrative data*                   0.1%  4%      11%    20%      64%
                  *Credit register; provisional data


                  1  Based  on  the  period in  which  HFCS  interviews  have  been  conducted,  the  data have  been
                  compared with FA data at end 2014 for DE, FR and IT, and end-2013 for FI.
                                                                     313 | I S I   W S C   2 0 1 9
   319   320   321   322   323   324   325   326   327   328   329