
Page 16 - Special Topic Session (STS) - Volume 2
P. 16
STS451 Yuji M.
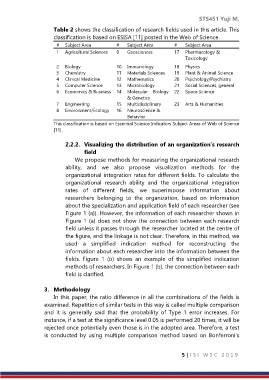
Table 2 shows the classification of research fields used in this article. This
classification is based on ESISA [11] posted in the Web of Science.
# Subject Area # Subject Area # Subject Area
1 Agricultural Sciences 9 Geosciences 17 Pharmacology &
Toxicology
2 Biology 10 Immunology 18 Physics
3 Chemistry 11 Materials Sciences 19 Plant & Animal Science
4 Clinical Medicine 12 Mathematics 20 Psychology/Psychiatry
5 Computer Science 13 Microbiology 21 Social Sciences, general
6 Economics & Business 14 Molecular Biology 22 Space Science
& Genetics
7 Engineering 15 Multidisciplinary 23 Arts & Humanities
8 Environment/Ecology 16 Neuroscience &
Behavior
This classification is based on Essential Science Indicators Subject Areas of Web of Science
[11].
2.2.2. Visualizing the distribution of an organization’s research
field
We propose methods for measuring the organizational research
ability, and we also propose visualization methods for the
organizational integration rates for different fields. To calculate the
organizational research ability and the organizational integration
rates of different fields, we superimpose information about
researchers belonging to the organization, based on information
about the specialization and application field of each researcher (see
Figure 1 (a)). However, the information of each researcher shown in
Figure 1 (a) does not show the connection between each research
field unless it passes through the researcher located at the centre of
the figure, and the linkage is not clear. Therefore, in this method, we
used a simplified indication method for reconstructing the
information about each researcher into the information between the
fields. Figure 1 (b) shows an example of the simplified indication
methods of researchers. In Figure 1 (b), the connection between each
field is clarified.
3. Methodology
In this paper, the ratio difference in all the combinations of the fields is
examined. Repetition of similar tests in this way is called multiple comparison
and it is generally said that the probability of Type 1 error increases. For
instance, if a test at the significance level 0.05 is performed 20 times, it will be
rejected once potentially even those is in the adopted area. Therefore, a test
is conducted by using multiple comparison method based on Bonferroni's
5 | I S I W S C 2 0 1 9