
Page 29 - Special Topic Session (STS) - Volume 2
P. 29
STS452 Joerg B.
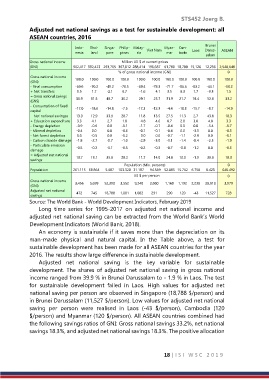
Adjusted net national savings as a test for sustainable development: all
ASEAN countries, 2016
Brunei
Indo- Thai- Singa- Philip- Malay- Viet Nam Myan- Cam- Darus-
nesia land pore pines sia mar bodia Laos ASEAN
salam
Gross national income Million US $ at current prices
(GNI) 902,417 392,423 293,765 367,012 288,414 196,687 61,780 18,788 15,126 12,236 2,548,648
% of gross national income (GNI) 0
Gross national income 100.0 100.0 100.0 100.0 100.0 100.0 100.0 100.0 100.0 100.0 100.0
(GNI)
- Final consumption -69.6 -70.2 -49.2 -70.5 -69.4 -78.3 -71.7 -86.6 -83.2 -44.1 -68.2
+ Net transfers 0.5 1.7 -2.1 6.7 -1.6 4.1 3.5 8.3 1.7 -3.3 1.5
= Gross national savings 30.9 31.5 48.7 36.2 29.1 25.7 31.9 21.7 18.4 52.6 33.2
(GNS)
- Consumption of fixed
capital -17.0 -18.6 -14.8 -7.5 -17.3 -12.3 -4.4 -10.3 -15.7 -8.7 -14.9
= Net national savingss 13.9 12.9 33.9 28.7 11.8 13.5 27.5 11.3 2.7 43.8 18.3
+ Education expenditure 3.3 4.1 2.7 1.8 4.8 4.6 0.7 2.0 3.0 4.0 3.3
- Energy depletion -0.9 -0.6 0.0 -0.1 -1.7 -0.7 -0.4 0.0 0.0 -5.4 -0.7
- Mineral depletion -0.4 0.0 0.0 -0.6 -0.1 -0.1 -0.4 0.0 -3.1 0.0 -0.3
- Net forest depletion 0.0 -0.5 0.0 -0.2 0.0 0.0 -0.7 -1.1 -2.9 0.0 -0.1
- Carbon dioxide damage -1.8 -2.7 -0.7 -1.0 -2.9 -3.0 -1.1 -1.4 -0.4 -2.5 -1.9
- Particulate emission -0.5 -0.2 -0.1 -0.5 -0.2 -0.3 -0.7 -0.8 -1.2 0.0 -0.3
damage
= Adjusted net national
savings 13.7 13.1 35.9 28.2 11.7 14.0 24.8 10.0 -1.9 39.9 18.3
Population (Mio. persons) 0
Population 261.115 68.864 5.607 103.320 31.187 94.569 52.885 15.762 6.758 0.423 640.492
US $ per person 0
Gross national income 3,456 5,699 52,390 3,552 9,248 2,080 1,168 1,192 2,238 28,913 3,979
(GNI)
Adjusted net national 472 745 18,788 1,001 1,082 291 290 120 -43 11,527 728
savings
Source: The World Bank - World Development Indicators, February 2019
Long time series for 1995-2017 on adjusted net national income and
adjusted net national saving can be extracted from the World Bank’s World
Development Indicators (World Bank, 2018).
An economy is sustainable if it saves more than the depreciation on its
man-made physical and natural capital. In the Table above, a test for
sustainable development has been made for all ASEAN countries for the year
2016. The results show large difference in sustainable development.
Adjusted net national saving is the key variable for sustainable
development. The shares of adjusted net national saving in gross national
income ranged from 39.9 % in Brunei Darussalam to - 1.9 % in Laos. The test
for sustainable development failed in Laos. High values for adjusted net
national saving per person are observed in Singapore (18,788 $/person) and
in Brunei Darussalam (11,527 $/person). Low values for adjusted net national
saving per person were realised in Laos (-43 $/person), Cambodia (120
$/person) and Myanmar (120 $/person). All ASEAN countries combined had
the following savings ratios of GNI: Gross national savings 33.2%, net national
savings 18.3%, and adjusted net national savings 18.3%. The positive allocation
18 | I S I W S C 2 0 1 9