
Page 212 - Special Topic Session (STS) - Volume 3
P. 212
STS540 J.-C. Malela-Majika et al.
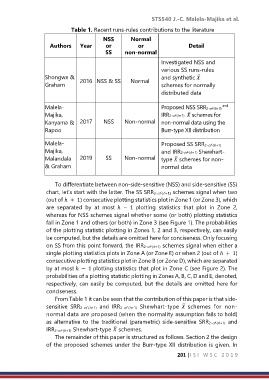
Table 1. Recent runs-rules contributions to the literature
NSS Normal
Authors Year or or Detail
SS non-normal
Investigated NSS and
various SS runs-rules
Shongwe & 2016 NSS & SS Normal and synthetic
̅
Graham schemes for normally
distributed data
Malela- Proposed NSS SRR2-of-(h+1) and
Majika, IRR2-of-(h+1) schemes for
̅
Kanyama & 2017 NSS Non-normal non-normal data using the
Rapoo Burr-type XII distribution
Malela- Proposed SS SRR2-of-(h+1)
Majika, and IRR2-of-(h+1) Shewhart-
Malandala 2019 SS Non-normal type schemes for non-
̅
& Graham normal data
To differentiate between non-side-sensitive (NSS) and side-sensitive (SS)
chart, let’s start with the latter. The SS SRR2-of-(h+1) schemes signal when two
(out of ℎ + 1) consecutive plotting statistics plot in Zone 1 (or Zone 3), which
are separated by at most ℎ − 1 plotting statistics that plot in Zone 2,
whereas for NSS schemes signal whether some (or both) plotting statistics
fall in Zone 1 and others (or both) in Zone 3 (see Figure 1). The probabilities
of the plotting statistic plotting in Zones 1, 2 and 3, respectively, can easily
be computed, but the details are omitted here for conciseness. Only focusing
on SS from this point forward, the IRR2-of-(h+1) schemes signal when either a
single plotting statistics plots in Zone A (or Zone E) or when 2 (out of ℎ + 1)
consecutive plotting statistics plot in Zone B (or Zone D), which are separated
by at most ℎ − 1 plotting statistics that plot in Zone C (see Figure 2). The
probabilities of a plotting statistic plotting in Zones A, B, C, D and E, denoted,
respectively, can easily be computed, but the details are omitted here for
conciseness.
From Table 1 it can be seen that the contribution of this paper is that side-
sensitive SRR2-of-(h+1) and IRR2-of-(h+1) Shewhart-type schemes for non-
̅
normal data are proposed (when the normality assumption fails to hold)
as alternative to the traditional (parametric) side-sensitive SRR2-of-(h+1) and
IRR2-of-(h+1) Shewhart-type schemes.
̅
The remainder of this paper is structured as follows. Section 2 the design
of the proposed schemes under the Burr-type XII distribution is given. In
201 |I S I W S C 2 0 1 9