
Page 210 - Special Topic Session (STS) - Volume 3
P. 210
STS540 J.-C. Malela-Majika et al.
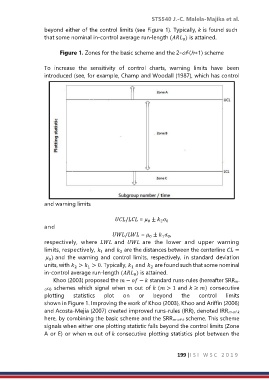
beyond either of the control limits (see Figure 1). Typically, is found such
that some nominal in-control average run-length ( ) is attained.
0
Figure 1. Zones for the basic scheme and the 2-of-(h+1) scheme
To increase the sensitivity of control charts, warning limits have been
introduced (see, for example, Champ and Woodall (1987), which has control
and warning limits
/ = ±
0
2 0
and
/ = ± ,
0
1 0
respectively, where and are the lower and upper warning
limits, respectively, and are the distances between the centerline =
1
2
) and the warning and control limits, respectively, in standard deviation
0
units, with > > 0. Typically, and are found such that some nominal
1
2
2
1
in-control average run-length ( ) is attained.
0
Khoo (2003) proposed the − − standard runs-rules (hereafter SRRm-
of-k) schemes which signal when out of ( > 1 and ≥ ) consecutive
plotting statistics plot on or beyond the control limits
shown in Figure 1. Improving the work of Khoo (2003), Khoo and Ariffin (2006)
and Acosta-Mejia (2007) created improved runs-rules (IRR), denoted IRRm-of-k
here, by combining the basic scheme and the SRRm-of-k scheme. This scheme
signals when either one plotting statistic falls beyond the control limits (Zone
A or E) or when out of consecutive plotting statistics plot between the
199 |I S I W S C 2 0 1 9