
Page 321 - Special Topic Session (STS) - Volume 3
P. 321
STS547 John D. et al.
records. Typically, this is done by recompiling the SPD without one of the
underlying data sources to get our trimmed list , then comparing , with
̂
N to see if they are the same. If , is less than then this indicates that
̂
̂
capture rate for the trimmed segment (size k) is less than the capture rate for
list indicating that there is a higher proportion of erroneous records in list
A compared to list . Therefore we consider estimator , to be less biased
̂
than . We can apply this idea iteratively to each data source in a strategy to
̂
eliminate erroneous records from the SPD and obtain a less biased and
possibly an unbiased estimate of the population.
An alternative trimming strategy could involve scoring records using
criteria correlated with the likelihood that those records are erroneous and
then incrementally trimming based on these scores to identify some point
where the trimming is no longer effective in removing bias (population
estimates are not changing significantly). The variance of the estimator should
also be monitored through the trimming. The variance of the trimmed
estimator is estimated in the same manner as that for the DSE estimator but
using list sizes and matches after trimming.
Alternative trimming strategies can be deployed. Effective trimming
strategies are those where trimming steps remove erroneous records without
removing too many valid records. The more valid records that are removed,
the smaller the match and hence the greater the variance of the estimator.
There is a cost to trimming and poor trimming strategies can lead to unstable
and possibly biased estimators with poor precision (large variance).
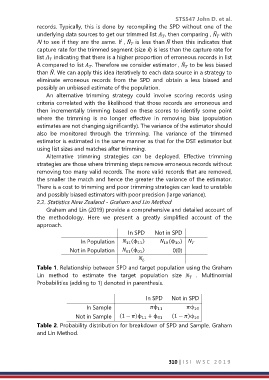
2.2. Statistics New Zealand - Graham and Lin Method
Graham and Lin (2019) provide a comprehensive and detailed account of
the methodology. Here we present a greatly simplified account of the
approach.
In SPD Not in SPD
In Population (ϕ ) (ϕ )
11
10
10
11
Not in Population (ϕ ) 0(0)
01
01
Table 1. Relationship between SPD and target population using the Graham
Lin method to estimate the target population size . Multinomial
Probabilities (adding to 1) denoted in parenthesis.
In SPD Not in SPD
In Sample ϕ ϕ
10
11
Not in Sample (1 − )ϕ 11 + ϕ (1 − )ϕ
10
01
Table 2. Probability distribution for breakdown of SPD and Sample. Graham
and Lin Method.
310 | I S I W S C 2 0 1 9