
Page 330 - Special Topic Session (STS) - Volume 3
P. 330
STS547 Maarten C. et al.
missingness ‘x’ for those individuals that are not on one list, and hence have
no value on the corresponding ethnicity variable (if only A = 0, a = ‘x’, and if
only C = 0, c = ‘x’ ). Last, there is unit missingness for those individuals that
are missed by both A and C.
A second presentation of the problem is in contingency table format, see
Table 1, Panel 1. The original 15 counts in Table 1, Panel 1, will have to be
redistributed over 3 subtables of dimension 2×2. I.e., the subtable of size 3×3
has to be reduced to size 2×2, the three values for A = 0; a = ‘x’ have to lead
to a subtable of size 2×2 and similarly for the three values for C = 0; c = ‘x’. In
a second step the subtable for A = 0; C = 0 has to be estimated, and this refers
to the individuals that are missed by both lists. Thus two types of missing data
are estimated. Estimates are found using the Expectation- Maximization
algorithm. Van der Heijden et al. (2018) show that the maximal loglinear model
that can be fitted to the data is [Ac][ac][Ca], where the highest fitted margins
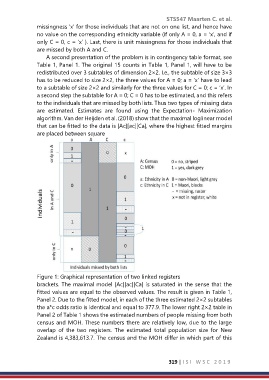
are placed between square
Figure 1: Graphical representation of two linked registers
brackets. The maximal model [Ac][ac][Ca] is saturated in the sense that the
fitted values are equal to the observed values. The result is given in Table 1,
Panel 2. Due to the fitted model, in each of the three estimated 2×2 subtables
the a*c odds ratio is identical and equal to 377.9. The lower right 2×2 table in
Panel 2 of Table 1 shows the estimated numbers of people missing from both
census and MOH. These numbers there are relatively low, due to the large
overlap of the two registers. The estimated total population size for New
Zealand is 4,383,613.7. The census and the MOH differ in which part of this
319 | I S I W S C 2 0 1 9