
Page 339 - Special Topic Session (STS) - Volume 3
P. 339
STS547 Daan Zult et al.
3. Results
We evaluate the WMR model with a simulation study. In this study the true
population size (TPS) is known and will be compared with estimates of the
population size. We use a (quasi – real) dataset that is a publicly available
fictitious population dataset of 26 625 persons that is representative for the UK
population census. It was created in a European project on data integration
(McLeod, Heasman and Forbes, 2011) that ran from 2009 to 2011. The dataset
has linkage keys such as address and birthdate but also covariates such as
gender and age. By generating sources from this quasi - real dataset, outcomes
may reflect reality to some extent.
The main goal of this simulation study is to evaluate the performance of the
WMR model. The WMR model is applied within different scenarios, where
scenarios differ with respect to three elements:
1. Covariate dependence of capture probabilities, which implies that the
probability of a record to be in , and may vary due to
1
3
2
differences in the covariate values of records (e.g. a male may have a
higher probability to be in and a lower probability to be in ).
1
2
2. Source dependence of capture probabilities, which implies that the
probability of a record to be in , and may depend on this
2
1
3
record being in another source (e.g. a record in , may have a
1
different probability to be in than a record that is equal in all other
2
aspects except being in ).
1
3. Linkage errors in the linkage procedure; sources are linked either with
errors or are linked perfectly without errors.
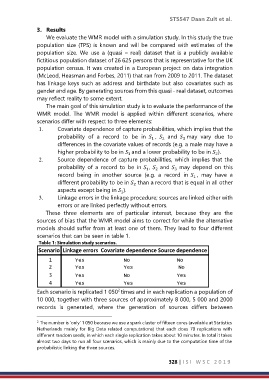
These three elements are of particular interest, because they are the
sources of bias that the WMR model aims to correct for while the alternative
models should suffer from at least one of them. They lead to four different
scenarios that can be seen in table 1.
Table 1: Simulation study scenarios.
Scenario Linkage errors Covariate dependence Source dependence
1 Yes No No
2 Yes Yes No
3 Yes No Yes
4 Yes Yes Yes
Each scenario is replicated 1 050 times and in each replication a population of
2
10 000, together with three sources of approximately 8 000, 5 000 and 2000
records is generated, where the generation of sources differs between
2 The number is ‘only’ 1 050 because we use a spark cluster of fifteen cores (available at Statistics
Netherlands mainly for Big Data related computations) that each does 70 replications with
different random seeds, in which each single replication takes about 10 minutes. In total it takes
almost two days to run all four scenarios, which is mainly due to the computation time of the
probabilistic linking the three sources.
328 | I S I W S C 2 0 1 9