
Page 340 - Special Topic Session (STS) - Volume 3
P. 340
STS547 Daan Zult et al.
scenarios. For further details on the simulation setup we refer to Zult et al.
(2019), in the next section we discuss the results.
3.1 Simulation outcome
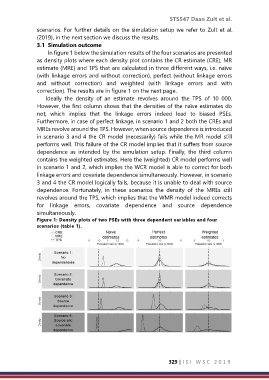
In figure 1 below the simulation results of the four scenarios are presented
as density plots where each density plot contains the CR estimate (CRE), MR
estimate (MRE) and TPS that are calculated in three different ways, i.e. naïve
(with linkage errors and without correction), perfect (without linkage errors
and without correction) and weighted (with linkage errors and with
correction). The results are in figure 1 on the next page.
Ideally the density of an estimate revolves around the TPS of 10 000.
However, the first column shows that the densities of the naïve estimates do
not, which implies that the linkage errors indeed lead to biased PSEs.
Furthermore, in case of perfect linkage, in scenario 1 and 2 both the CREs and
MREs revolve around the TPS. However, when source dependence is introduced
in scenario 3 and 4 the CR model (necessarily) fails while the MR model still
performs well. This failure of the CR model implies that it suffers from source
dependence as intended by the simulation setup. Finally, the third column
contains the weighted estimates. Here the (weighted) CR model performs well
in scenario 1 and 2, which implies the WCR model is able to correct for both
linkage errors and covariate dependence simultaneously. However, in scenario
3 and 4 the CR model logically fails, because it is unable to deal with source
dependence. Fortunately, in these scenarios the density of the MREs still
revolves around the TPS, which implies that the WMR model indeed corrects
for linkage errors, covariate dependence and source dependence
simultaneously.
Figure 1: Density plots of two PSEs with three dependent variables and four
scenarios (table 1).
329 | I S I W S C 2 0 1 9