
Page 102 - Special Topic Session (STS) - Volume 4
P. 102
STS566 K. Prokopenko et al.
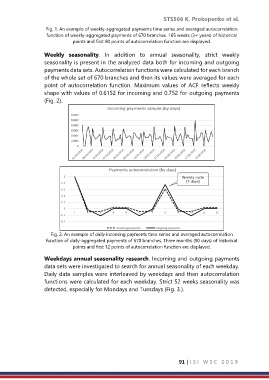
Fig. 1. An example of weekly-aggregated payments time series and averaged autocorrelation
function of weekly-aggregated payments of 670 branches. 165 weeks (3+ years) of historical
points and first 80 points of autocorrelation function are displayed.
Weekly seasonality. In addition to annual seasonality, strict weekly
seasonality is present in the analyzed data both for incoming and outgoing
payments data sets. Autocorrelation functions were calculated for each branch
of the whole set of 670 branches and then its values were averaged for each
point of autocorrelation function. Maximum values of ACF reflects weekly
shape with values of 0.6152 for incoming and 0.752 for outgoing payments
(Fig. 2).
Fig. 2. An example of daily incoming payments time series and averaged autocorrelation
function of daily-aggregated payments of 670 branches. Three months (90 days) of historical
points and first 12 points of autocorrelation function are displayed.
Weekdays annual seasonality research. Incoming and outgoing payments
data sets were investigated to search for annual seasonality of each weekday.
Daily data samples were interleaved by weekdays and then autocorrelation
functions were calculated for each weekday. Strict 52 weeks seasonality was
detected, especially for Mondays and Tuesdays (Fig. 3.).
91 | I S I W S C 2 0 1 9