
Page 104 - Special Topic Session (STS) - Volume 4
P. 104
STS566 K. Prokopenko et al.
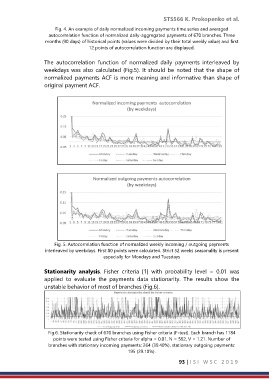
Fig. 4. An example of daily normalized incoming payments time series and averaged
autocorrelation function of normalized daily-aggregated payments of 670 branches. Three
months (90 days) of historical points (values were divided by their total weekly value) and first
12 points of autocorrelation function are displayed.
The autocorrelation function of normalized daily payments interleaved by
weekdays was also calculated (Fig.5). It should be noted that the shape of
normalized payments ACF is more meaning and informative than shape of
original payment ACF.
Fig. 5. Autocorrelation function of normalized weekly incoming / outgoing payments
interleaved by weekdays. First 80 points were calculated. Strict 52 weeks seasonality is present
especially for Mondays and Tuesdays
Stationarity analysis. Fisher criteria [1] with probability level = 0.01 was
applied to evaluate the payments data stationarity. The results show the
unstable behavior of most of branches (Fig.6).
Fig.6. Stationarity check of 670 branches using Fisher criteria (F-test). Each branch has 1184
points were tested using Fisher criteria for alpha = 0.01, N = 592, V = 1.21. Number of
branches with stationary incoming payments: 264 (39.40%), stationary outgoing payments:
195 (29.10%).
93 | I S I W S C 2 0 1 9