
Page 208 - Special Topic Session (STS) - Volume 4
P. 208
STS580 Ross Sparks et. al
simultaneously, by investigated its nature of the trends in the Pearson
residuals.
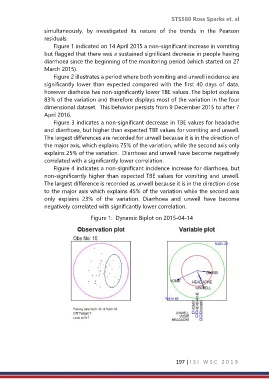
Figure 1 indicated on 14 April 2015 a non-significant increase in vomiting
but flagged that there was a sustained significant decrease in people having
diarrhoea since the beginning of the monitoring period (which started on 27
March 2015).
Figure 2 illustrates a period where both vomiting and unwell incidence are
significantly lower than expected compared with the first 40 days of data,
however diarheoa has non-significantly lower TBE values. The biplot explains
83% of the variation and therefore displays most of the variation in the four
dimensional dataset. This behavior persists from 9 December 2015 to after 7
April 2016.
Figure 3 indicates a non-significant decrease in TBE values for headache
and diarrhoea, but higher than expected TBE values for vomiting and unwell.
The largest differences are recorded for unwell because it is in the direction of
the major axis, which explains 75% of the variation, while the second axis only
explains 25% of the variation. Diarrhoea and unwell have become negatively
correlated with a significantly lower correlation.
Figure 4 indicates a non-significant incidence increase for diarrhoea, but
non-significantly higher than expected TBE values for vomiting and unwell.
The largest difference is recorded as unwell because it is in the direction close
to the major axis which explains 45% of the variation while the second axis
only explains 23% of the variation. Diarrhoea and unwell have become
negatively correlated with significantly lower correlation.
Figure 1: Dynamic Biplot on 2015-04-14
197 | I S I W S C 2 0 1 9